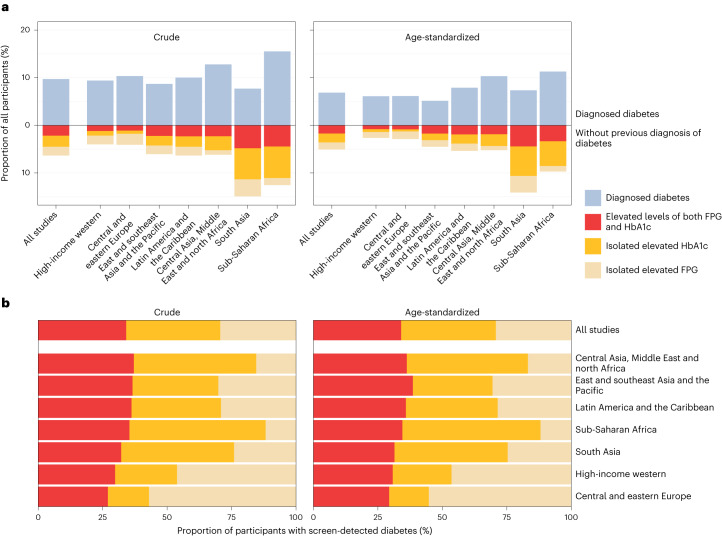
Fig. 2. Extent and composition of diagnosed and screen-detected diabetes by region.
a, Crude and age-standardized proportion of participants with diagnosed or screen-detected diabetes and, for those without previous diagnosis, whether they had isolated elevated FPG (FPG ≥ 7.0 mmol l−1 and HbA1c < 6.5%), isolated elevated HbA1c (HbA1c ≥ 6.5% and FPG < 7.0 mmol l−1) or elevated levels of both. b, Crude and age-standardized proportion of participants with screen-detected diabetes who had isolated elevated FPG, isolated elevated HbA1c or elevated levels of both, by region. The contents in b are the same as the segment of a that is below the zero line, scaled to 100% so that the composition of screen-detected diabetes can be compared across regions, regardless of its total prevalence. Having elevated levels of both biomarkers has high positive predictive value for subsequent clinical diagnosis and risk of complications14,47 and hence this group is similar to clinically diagnosed diabetes. In a, regions are ordered by the total proportion of participants who had diagnosed and screen-detected diabetes. In b, regions are ordered by the crude proportion of participants with screen-detected diabetes who had elevated levels of both FPG and HbA1c. Extended Data Fig. 1 provides sex-specific results.

