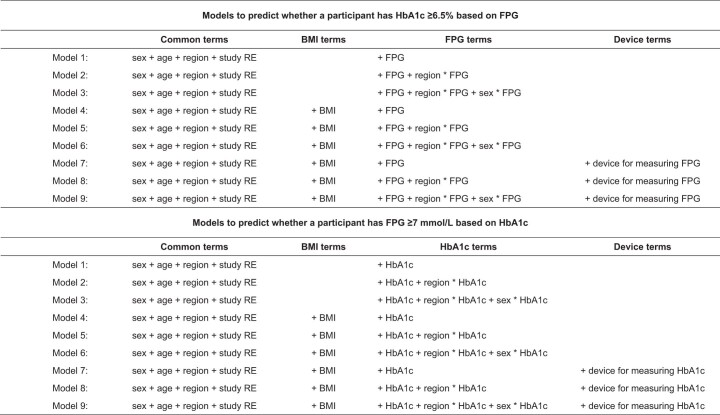
Extended Data Table 2.
Specification of models tested to predict whether a participant has HbA1c ≥6.5% based on FPG levels, and to predict whether a participant has FPG ≥7.0 mmol/L based on HbA1c levels
* denotes statistical interaction.
Age, FPG, HbA1c and BMI were normalized using the following values (approximately equal to mean and standard deviation across all participants):
Age: centered at 50 years, divided by 15 years
FPG: centered at 5.5 mmol/L, divided by 1.0 mmol/L
HbA1c: centered at 5.5%, divided by 0.7%
BMI: centered at 26.5 kg/m2, divided by 5.0 kg/m2
FPG: fasting plasma glucose; BMI: body-mass index; RE: random effect.

