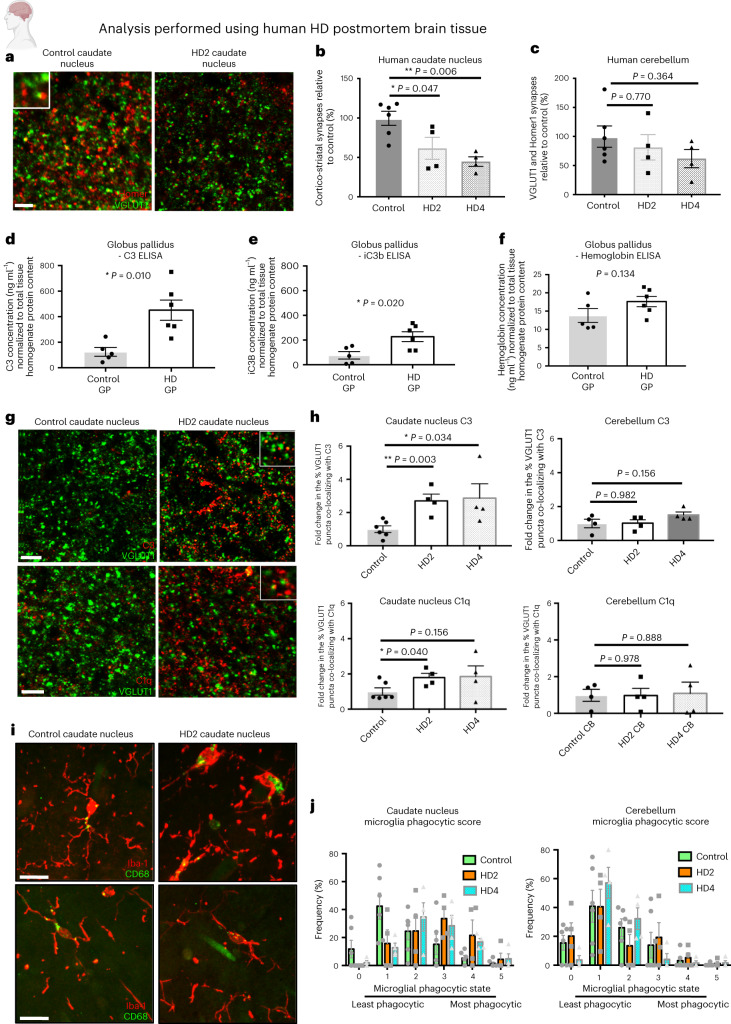
Fig. 1. Loss of corticostriatal synapses, increased activation and association of complement proteins with synaptic elements and adoption of a more phagocytic microglial state are evident in postmortem brain tissue from patients with HD.
a, Representative confocal images showing staining for corticostriatal specific presynaptic marker VGLUT1 and postsynaptic density protein Homer1 in the postmortem caudate nucleus of a control individual and a Vonsattel grade 2 patient with HD (Supplementary Table 2). Scale bar, 5 μm. b, Quantification of corticostriatal synapses (co-localized VGLUT1 and Homer1 puncta) in the caudate nucleus of control, Vonsattel grade 2 and Vonsattel grade 4 HD tissue, n = 6 control, n = 4 HD with Vonsattel 2 tissue grade and 4 HD with Vonsattel 4 tissue grade. One-way ANOVA P = 0.0058; Tukey’s multiple comparisons test, control versus HD2 P = 0.0474; control versus HD4 P = 0.0061; HD2 versus HD4 P = 0.537. c, The same analysis carried out in the molecular layer of the folia of the cerebellum (an area thought to be less impacted by disease) showed no change, n = 6 control individuals, 4 HD Vonsattel grade 2 and 4 HD Vonsattel grade 4. One-way ANOVA, P = 0.393; Tukey’s multiple comparisons test, control versus HD2 P = 0.770; control versus HD4 P = 0.365; HD2 versus HD4 P = 0.791. d, ELISA measurements of complement component C3 in extracts from the globus pallidus (GP) of postmortem tissue from manifest HD patients and control individuals (Supplementary Table 2) after normalization for total tissue homogenate protein content, n = 5 control GP and 6 HD GP. ANCOVA controlling for the effect of age F2,10 = 8.74, P = 0.010. e, ELISA measurements of complement component iC3b in the same extracts as d. ANCOVA controlling for the effect of age F2,10 = 6.71, P = 0.020. f, ELISA hemoglobin measurements in the same extracts as d. Unpaired two-tailed t-test P = 0.134. g, Representative confocal images showing staining for VGLUT1 together with C3 or C1q in the postmortem caudate nucleus of a control individual and a patient with HD who has been assessed to be Vonsattel grade 2. Scale bar, 5 μm. Insets show examples of co-localization of both complement proteins with presynaptic marker VGLUT1. h, Quantification of the percentage of VGLUT1+ glutamatergic synapses associating with C3 and C1q puncta in the caudate nucleus and cerebellum of postmortem tissue from patients with HD assessed to be either Vonsattel grade 2 or Vonsattel grade 4 relative to that seen in tissue from control individuals. For C3 in the caudate nucleus samples, n = 6 control individuals, n = 4 HD individuals with Vonsattel tissue grade 2 and n = 4 HD individuals with Vonsattel grade 4. One-way ANOVA, P = 0.029. Unpaired two-tailed t-test control versus HD2 P = 0.003; control versus HD4 P = 0.034. For C1Q in the caudate nucleus samples, n = 6 control individuals, n = 4 HD individuals with Vonsattel tissue grade 2 and n = 4 HD individuals with Vonsattel tissue grade 4. One-way ANOVA, P = 0.181. Unpaired two-tailed t-test, control versus HD2 P = 0.040, control versus HD4 P = 0.156. For C3 and C1Q in the cerebellum samples, n = 4 control individuals, n = 4 HD individuals with Vonsattel tissue grade 2 and n = 4 HD individuals with Vonsattel tissue grade 4. For C3, one-way ANOVA, P = 0.215. Unpaired two-tailed t-test, control versus HD2 P = 0.982; control versus HD4 P = 0.156. For C1q, one-way ANOVA, P = 0.981. Unpaired two-tailed t-test, control versus HD2 P = 0.978; control versus HD4 P = 0.888. i, Representative confocal images showing staining for Iba-1 and CD68 in the caudate nucleus and cerebellum of postmortem tissue from a control individual and a patient with HD (Vonsattel grade 2). Scale bar, 20 μm. j, Quantification of microglia phagocytic state based on changes in morphology and CD68 levels. For caudate nucleus samples, n = 6 control individuals, n = 4 HD individuals with Vonsattel tissue grade 2 and n = 4 HD individuals with Vonsattel tissue grade 4. Multiple unpaired two-tailed t-tests, control versus HD2; score 0 P = 0.253, score 1 P = 0.01, score 2 P = 0.984, score 3 P = 0.077, score 4 iP = 0.116 and score 5 P = 0.776. Control versus HD4; score 0 P = 0.255, score 1 P = 0.039, score 2 P = 0.382, score 3 P = 0.256, score 4 P = 0.006 and score 5 P = 0.309. For cerebellum samples, n = 6 control individuals, n = 4 HD individuals with Vonsattel tissue grade 2 and n = 4 HD individuals with Vonsattel tissue grade 4. Multiple unpaired two-tailed t-tests, control versus HD2; score 0 P = 0.635, score 1 P = 0.988, score 2 P = 0.243, score 3 P = 0.706, score 4 P = 0.610 and score 5 P = 0.477. Control versus HD4; score 0 P = 0.120, score 1 P = 0.348, score 2 P = 0.538, score 3 P = 0.415, score 4 P = 0.609 and score 5 P = 0.418. All error bars represent s.e.m. *P < 0.05, **P < 0.01 and ***P < 0.001.

