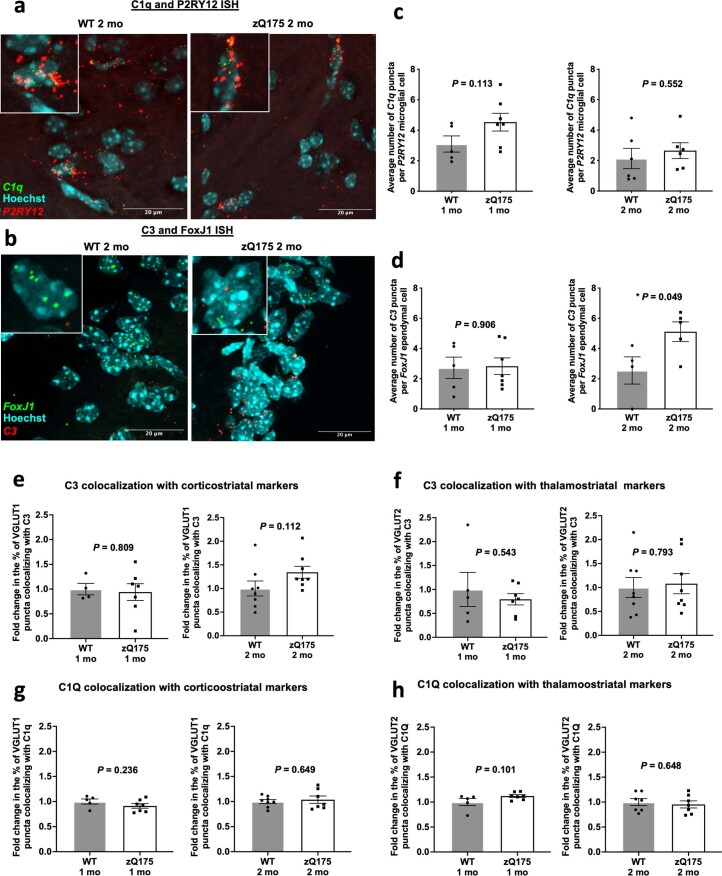
Extended Data Fig. 4. Expression and synaptic localization of complement proteins in HD mouse models.
(a) Representative in situ hybridization (ISH) staining of C1q and P2RY12 in the dorsal striatum of a 2 mo zQ175 mouse and a WT littermate. (b) Representative ISH staining of C3 and FoxJ1 in the wall of the lateral ventricle of a 2 mo zQ175 mouse and a WT littermate. For both a and b scale bar = 20 μm. (c) Bar charts showing quantification of RNAScope staining with the average number of IF C1q puncta in P2RY12 expressing microglia (in the dorsal striatum) determined for zQ175 mice and WT littermates at both 1 and 2 mo; 1 mo n = 5 WT and 7 zQ175 (3 F and 2 M for WT and 3 F and 4 M for zQ175) and 2 mo n = 6WT and 6 zQ175 (2 F and 4 M for WT and 3 F and 3 M for zQ175). Unpaired t test, at 1 mo p = 0.113 and at 2 mo p = 0.552. (d) Bar charts showing quantification of RNAScope staining with the average number of IF C3 puncta in FoxJ1 ependymal cells (present in the wall of the lateral ventricle) determined for zQ175 mice and WT littermates at both 1 and 2 mo; 1 mo n = 5 WT and 7 zQ175 (3 F and 2 M for WT and 3 F and 4 M for zQ175) and 2 mo n = 4 WT and 5 zQ175 (2 M and 2 F for WT and 2 F and 3 M for zQ175). Unpaired t test, at 1 mo p = 0.906 and at 2 mo p = 0.049. (e) Bar chart showing quantification of the percentage of VGLUT1 puncta colocalizing with C3 in the dorsolateral striatum of 1 and 2 mo zQ175 mice and WT littermates; At 1 mo n = 4 WT and 7 zQ175 mice (2 F and 2 M for WT and 4 M and 3 F for zQ175) and at 2 mo n = 8 WT and 8 zQ175 mice (2 F and 6 M for WT and 3 F and 5 M for zQ175). Unpaired two-tailed t-test, at 1 mo p = 0.809 and at 2 mo p = 0.112. (f) Bar chart showing quantification of the percentage of VGLUT2 puncta colocalizing with C3 in the dorsolateral striatum of 1 and 2 mo zQ175 mice and WT littermates; At 1 mo n = 5 WT and 7 zQ175 mice (2 F and 3 M for WT and 4 M and 3 F for zQ175) and at 2 mo n = 8 WT and 8 zQ175 mice (2 F and 6 M for WT and 3 F and 5 M for zQ175). Unpaired two-tailed t-test, at 1 mo p = 0.543 and at 2 mo p = 0.793. (g) Bar chart showing quantification of the percentage of VGLUT1 puncta colocalizing with C1Q in the dorsolateral striatum of 1 and 2 mo zQ175 mice and WT littermates; At 1 mo n = 5 WT and 7 zQ175 mice (2 F and 3 M for WT and 4 M and 3 F for zQ175) and at 2 mo n = 8 WT and 7 zQ175 mice (2 F and 6 M for WT and 3 F and 4 M for zQ175). Unpaired two-tailed t-test, at 1 mo p = 0.236 and at 2 mo p = 0.649. (h) Bar chart showing quantification of the percentage of VGLUT2 puncta colocalizing with C1Q in the dorsolateral striatum of 1 and 2 mo zQ175 mice and WT littermates; At 1 mo n = 5 WT and 7 zQ175 mice (2 F and 3 M for WT and 4 M and 3 F for zQ175) and at 2 mo n = 7 WT and 7 zQ175 mice (2 F and 5 M for WT and 3 F and 4 M for zQ175). Unpaired two-tailed t-test, at 1 mo p = 0.101 and at 2 mo p = 0.648. All error bars represent SEM. Stars depict level of significance with *=p < 0.05, **p = <0.01 and ***p < 0.001.

