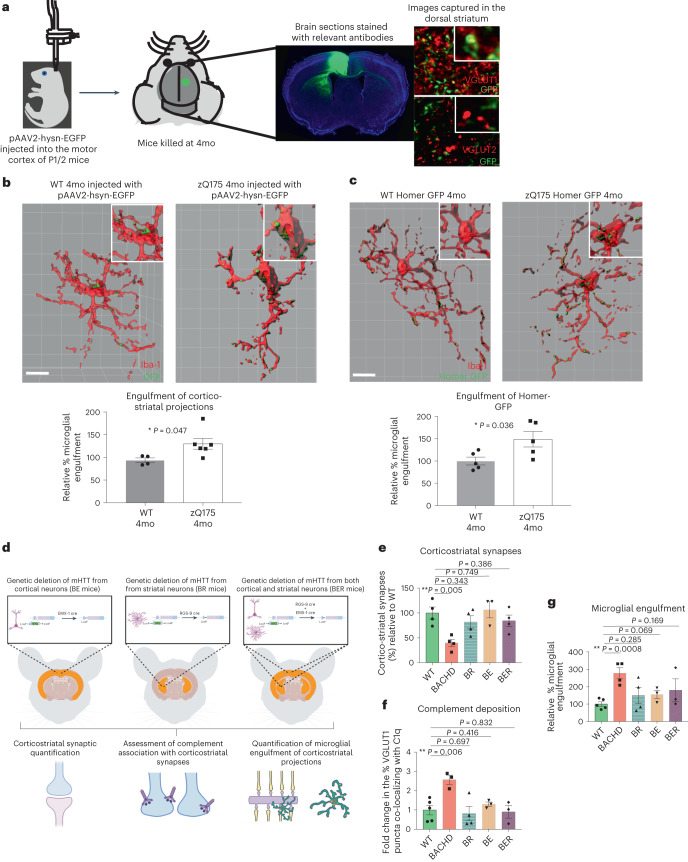
Fig. 4. Microglia in the striatum of HD mice engulf more corticostriatal projections and synaptic material in a manner that is dependent on expression of neuronal mHTT.
a, Schematic showing labeling of corticostriatal projections with pAAV2-hsyn-EGFP injection into the motor cortex of neonatal mice. Panels to the right show co-localization of GFP signal in the dorsal striatum with VGLUT1, a marker of the corticostriatal synapse, but not VGLUT2, a marker of the thalamostriatal synapse. b, Representative surface-rendered images of Iba1+ microglia and engulfed GFP-labeled corticostriatal projections in the dorsal striatum of 4-month-old zQ175 and WT mice. Scale bar, 10 μm. Bar chart shows quantification of the relative % microglia engulfment (the volume of engulfed inputs expressed as a percentage of the total volume of the microglia) in 4-month-old zQ175 mice relative to that seen in WT littermate controls. All engulfment values were normalized to the total number of inputs in the field, n = 4 WT and 6 zQ175 mice. Unpaired two-tailed t-test, P = 0.047. c, Representative surface-rendered images of Iba1+ microglia and engulfed Homer-GFP in the dorsal striatum of 4-month-old zQ175 Homer-GFP mice and WT Homer-GFP littermates. Scale bar, 10 μm. Bar charts show quantification of the relative % microglia engulfment of Homer-GFP in 4-month-old zQ175 Homer-GFP mice relative to that seen in WT Homer-GFP littermate controls, n = 5 WT Homer-GFP and 5 zQ175 Homer-GFP mice. Unpaired two-tailed t-test, P = 0.036. d, Schematic showing the strategy that we adopted to genetically ablate mHTT from striatal neurons or cortical neurons or both populations before interrogating corticostriatal synaptic density, complement association with corticostriatal markers and microglial-mediated engulfment of these synapses in these mice. e, Quantification of the % of corticostriatal synapses in the dorsal striatum of BACHD, BR (deletion of mHTT in striatal neurons), BE (deletion of mHTT in cortical neurons) and BER (deletion of mHTT in striatal and cortical neurons) mice normalized to those seen in WT littermates, n = 4 WT mice, 4 BACHD mice, 4 BR mice, 3 BE mice and 4 BER mice. Unpaired two-tailed t-test with comparison to WT, BACHD P = 0.005, BR P = 0.343, BE P = 0.749 and BER P = 0.386. f, % of VGLUT1 puncta co-localized with C1q in the dorsal striatum of BACHD, BR, BE and BER mice and WT littermate controls, n = 5 WT mice, 3 BACHD mice, 4 BR mice, 3 BE mice and 3 BER mice. Unpaired two-tailed t-test with comparison to WT, BACHD P = 0.006, BR P = 0.697, BE P = 0.416 and BER P = 0.832. g, Quantification of the relative % microglial engulfment of corticostriatal projections in the dorsal striatum of BACHD, BR, BE, BER and WT mice, n = 5 WT mice, 4 BACHD mice, 4 BR mice, 3 BE mice and 3 BER mice. Unpaired two-tailed t-test with comparison to WT, BACHD P = 0.0008, BR P = 0.285, BE P = 0.069 and BER P = 0.169. For bar charts, bars depict the mean. All error bars represent s.e.m. *P < 0.05, **P < 0.01 and ***P < 0.001. mo, months old.

