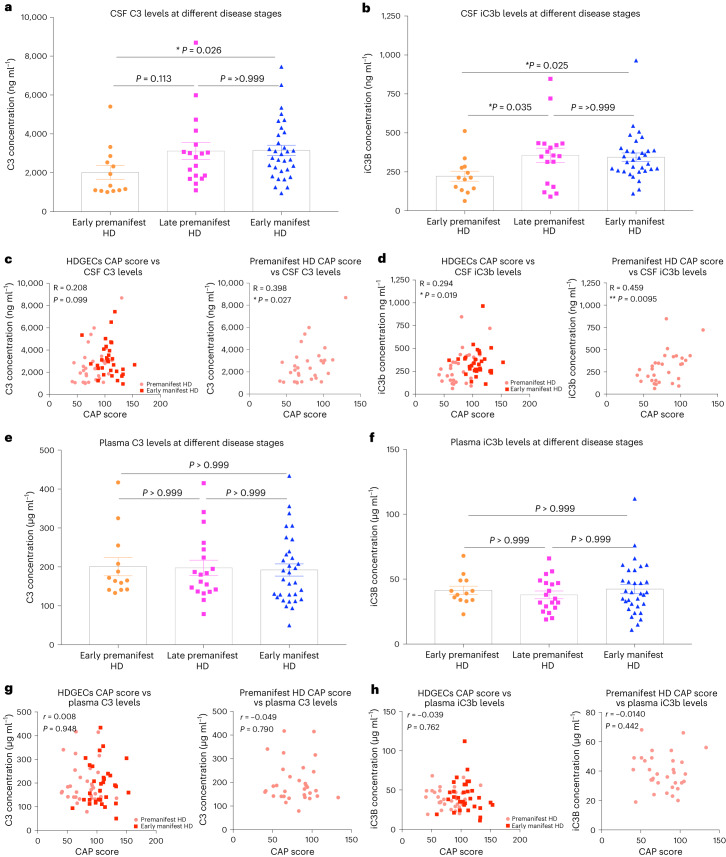
Fig. 6. Association between disease stage and complement component levels in the CSF and plasma of patients with HD.
a, Quantification of the concentration of complement component C3 in CSF samples from early premanifest HD patients, late premanifest HD patients and early manifest HD patients (see Methods for details) recruited into the HDClarity study. Each dot represents a sample from a separate individual, and the bar denotes the mean for each group—n = 13 early premanifest HD, n = 18 late premanifest HD and n = 32 early manifest HD. Kruskal–Wallis test (non-parametric ANOVA) P = 0.028 with early premanifest versus late premanifest HD P = 0.113, late premanifest versus early manifest HD P = >0.999 and early premanifest versus early manifest HD P = 0.026 via Dunn’s multiple comparison test. b, Quantification of the concentration of iC3b, the cleaved component of C3 that is formed after activation of the complement cascade, in the same CSF samples assayed in a. Kruskal–Wallis test (non-parametric ANOVA) P = 0.017 with early premanifest HD versus late premanifest HD P = 0.035, late premanifest HD versus early manifest HD P > 0.999 and early premanifest HD versus early manifest HD P = 0.025. c, Graphs showing association between CAP score and CSF C3 concentration for all samples from HDGECs as well as those just from premanifest HD patients recruited into the HDClarity study, n = 63 HDGECs and n = 31 premanifest HD. Spearman r for HDGECs P = 0.099; for premanifest HD P = 0.027. d, Graphs showing association between CAP score and CSF iC3b concentration for all samples from HDGECs as well as those just from premanifest HD patients recruited into the HDClarity study, n = 63 HDGECs and n = 31 premanifest HD. Spearman r for HDGECs P = 0.019; for premanifest HD P = 0.0095. e, Bar chart showing the concentration of complement component C3 in plasma samples from early premanifest HD patients, late premanifest HD patients and early manifest HD patients (see Methods for inclusion criteria) recruited into the HDClarity study, n = 13 early premanifest HD, n = 19 late premanifest HD and n = 32 early manifest HD. Kruskal–Wallis test (non-parametric ANOVA) P = 0.797 with early premanifest versus late premanifest HD P > 0.999, late premanifest versus early manifest HD P > 0.999 and early premanifest versus early manifest HD P > 0.999 via Dunn’s multiple comparison test. f, Bar chart showing the concentration of iC3b, the cleaved component of C3 formed after activation of the complement cascade, in the same plasma samples assayed in e. Kruskal–Wallis test (non-parametric ANOVA) P = 0.609 with early premanifest HD versus late premanifest HD P > 0.999, late premanifest HD versus early manifest HD P > 0.999 and early premanifest HD versus early manifest HD P > 0.999. g, Graphs showing the association between CAP score and plasma C3 concentration for all samples from HDGECs as well as those just from premanifest HD patients recruited into the HDClarity study, n = 64 HDGECs and n = 32 premanifest HD. Spearman r for HDGECs P = 0.948; for premanifest HD P = 0.790. h, Graphs showing association between CAP score and plasma iC3b concentration for all samples from HDGECs as well as those just from premanifest HD patients recruited into the HDClarity study, n = 64 HDGECs and n = 32 premanifest HD. Spearman r for HDGECs P = 0.762; for premanifest HD P = 0.442. For bar charts, bars depict the mean. All error bars represent s.e.m. *P < 0.05, **P < 0.01 and ***P < 0.001.

