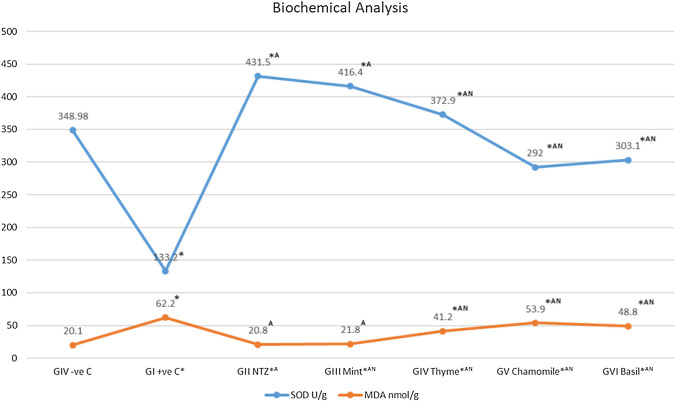
Fig. 4.
SOD (U/g tissue) and MDA (nmol/g tissue) levels in all groups. *Statistically significant (P value < 0.0001) compared to GVII (Negative control), A statistically significant (P value < 0.0001) compared to GI (Positive control), N statistically significant (P value < 0.0001) compared to GII (NTZ treated)

