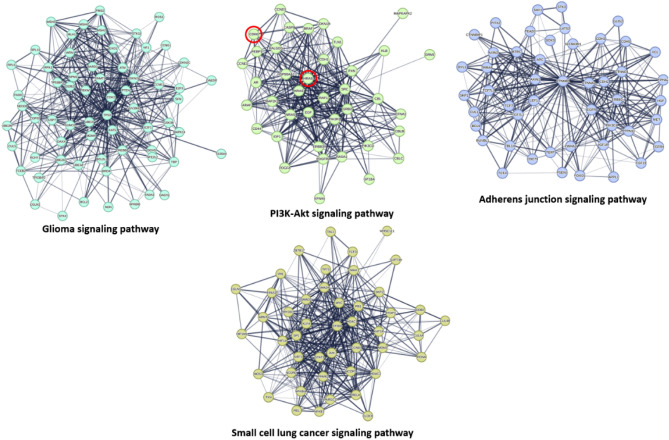
Figure 5.
Subnetworks derived from the complete cancer-relevant network in Fig. 4. These networks represent the first 4 key pathways involved in cancer pathogenesis according to the presented PPI networking in Fig. 4. The thickness of the lines (i.e., edges) represents the degree of confidence (i.e., the strength of data support). Nodes encircled with red line in the PI3K-Akt signaling pathway cluster are CDK6 and HRAS that were predicted to be potential targets for compound 3.

