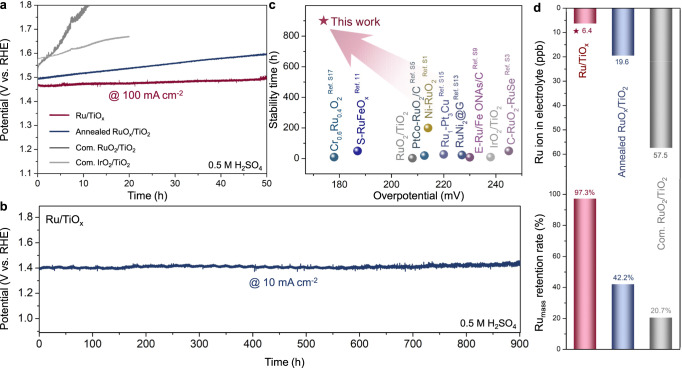
Fig. 3. Electrocatalytic OER stability in 0.5 M H2SO4 solutions (pH = 0.3).
a Chronoamperometric curves of Ru/TiOx, annealed RuOx/TiO2, com. RuO2/TiO2 and com. IrO2/TiO2 for OER at 100 mA cm−2. The chronoamperometric curves are not iR compensated. Mass loadings of noble metals are 0.0715, 0.0867, 0.0992, and 0.1135 mg cm−2 for Ru/TiOx, annealed RuOx/TiO2, com. RuO2/TiO2 and com. IrO2/TiO2, respectively. b Chronoamperometric curves of Ru/TiOx for OER at 10 mA cm-2. c Comparison of the overpotential and stability time of Ru/TiOx with state-of-the-art OER electrocatalysts in acidic media. d Inductively coupled plasma-mass spectrometry (ICP-MS) analysis for dissolved Ru ions in post chronopotentiometry electrolyte and Ru mass percentage retained in Ru/TiOx, annealed RuOx/TiO2 and com. RuO2/TiO2 catalyst after the chronoamperometric test.

