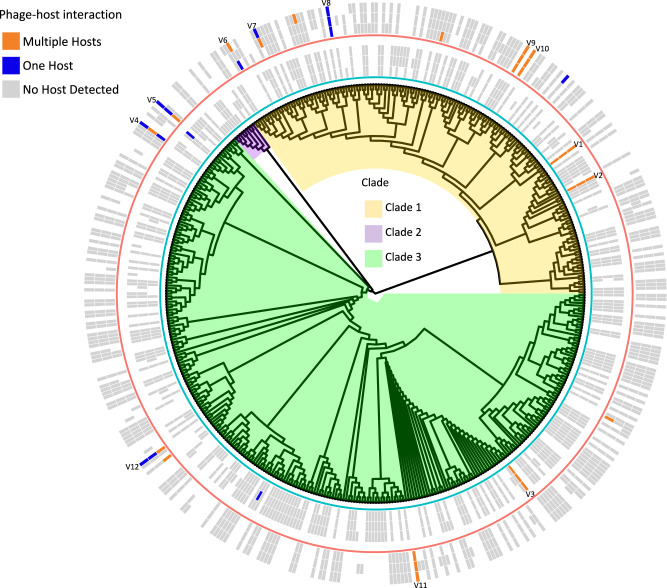
Fig. 2. Soil phage–host interactions revealed using Hi–C metagenomics.
Hi–C metagenomics was used to characterize host-associated vOTUs in pre- and post-desiccation soils. The tree of all the detected vOTUs based on genome-wide similarities is shown in the center with the three major clades colored in yellow (Clade 1), purple (Clade 2) and green (Clade 3). The two heatmaps outside the tree indicate the vOTUs that were detected in each of the three replicate samples. The outlines underneath each heatmap indicate the experimental conditions: Pre-desiccation (inner circle, blue); Post-desiccation (outer circle, red). The cells of the heatmaps are colored by the type of phage-host interaction of each vOTU: Multiple Hosts in orange, One Host in dark blue, and No Host Detected in gray. Empty (white) cells indicate the vOTUs were not detected in the sample. The vOTUs linked to the same host(s) in at least two replicates are labeled. Source data are provided as a Source Data file.

