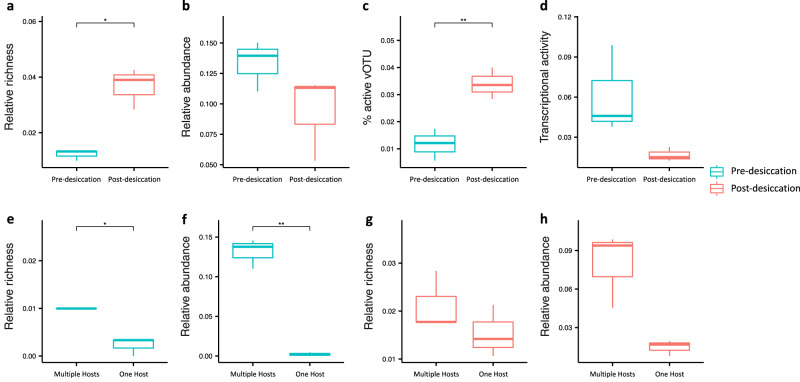
Fig. 3. Richness, abundance, and transcriptional activities of host-associated vOTUs.
a Relative richness of host-associated vOTUs to total vOTU richness in pre- and post-desiccation soil incubations. The relative richness of the host-associated vOTUs was calculated by dividing the number of host-associated vOTUs by the number of the total recovered vOTUs. b Relative abundance of the host-associated vOTUs to total vOTU abundance. c Percentage of transcriptionally active vOTUs that were host-associated. d Percentage of transcripts that were mapped to the host-associated vOTUs. Comparison of relative richness e and relative abundances f of the vOTUs infecting multiple hosts (Multiple Hosts) and the vOTUs infecting one host (One Host) in wet soils. Comparison of relative richness g and relative abundances h of the vOTUs infecting multiple hosts (Multiple Hosts) and the vOTUs infecting one host (One Host) in post-desiccation soils. The relative richness of the vOTUs infecting multiple hosts or one host was calculated by dividing the number of those vOTUs by the number of the total recovered vOTUs. Each panel contains a box plot for comparing the three biological replicates with the pre-desiccation treatment (n = 3) against the three biological replicates with the post-desiccation treatment (n = 3). Boxes colored in blue and red represent Pre-desiccation and Post-desiccation soil incubation treatments, respectively. In each boxplot, the top and bottom of each box represent the 25th and 75th percentiles, and the center line indicates the median. The upper and lower whiskers of each box represent the maximum and minimum values detected in the three biological replicates, respectively. The differences between the pre-and post-desiccation treatments were assessed using a two-sided t-test. The significant differences in all panels are highlighted by asterisks, with * representing p < 0.05 and ** p < 0.01. The exact p-values of the comparisons shown in panels a–h are 0.02, 0.18, 0.009, 0.06, 0.02, 0.006, 0.28 and 0.06, respectively. Source data are provided as a Source Data file.

