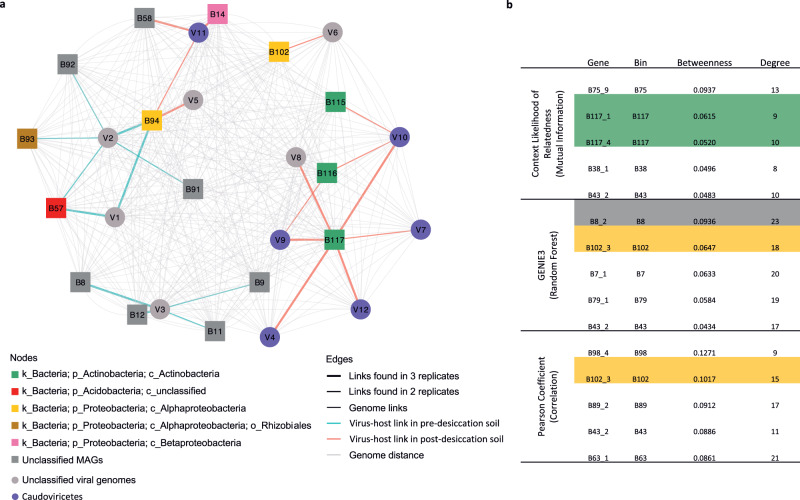
Fig. 4. Phage–host infection network and community co-occurrence analysis.
a Phage–host infection network showing phage-host pairs that were detected in at least two replicate soils. vOTUs and their linked hosts are shown as nodes in circular and rectangular shapes, respectively. The nodes are colored by taxonomic assignment. Host–host and vOTU-vOTU edges are colored in gray and the vOTU-host edges are colored by treatment (Pre-desiccation: blue; Post-desiccation: red). Edge thickness corresponds to the number of replicates in which the vOTU-host interaction was observed. b The top five metagenome assembled genomes (MAGs) by betweenness centrality using three network inference methods. The MAGs identified as phage hosts are highlighted and colored by their taxonomic assignment following the same color scheme used in panel a. Source data are provided as a Source Data file.

