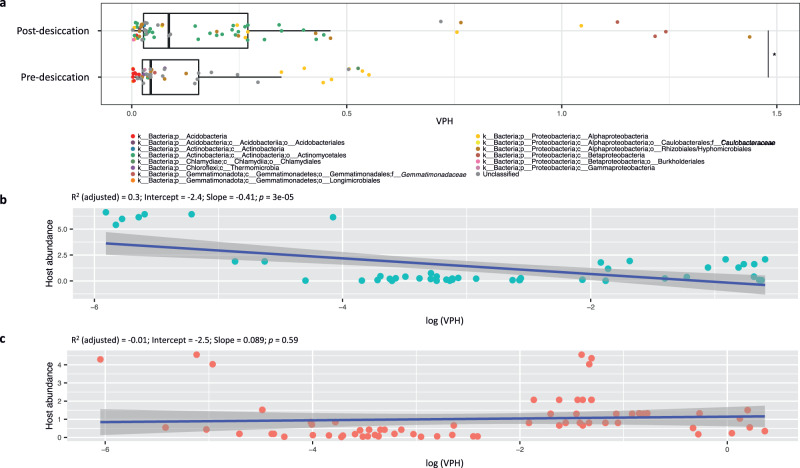
Fig. 5. Prevalence of phage infections in bacterial host populations.
a The viral (phage) copies per host (VPH) detected in soils pre- and post-desiccation. Each data point is a single de-replicated MAG linked to phage by Hi-C sequencing and represents a phage host population. The phage host populations are identified from at least two of the three biological replicates of the soils with the pre-desiccation (n = 49 unique populations) or post-desiccation treatment (n = 69 unique populations). Datapoints are colored by host taxonomic assignment. The top and bottom of each box represent the 25th and 75th percentiles, and the center line indicates the median. The upper and lower whiskers of each box represent the maximum and minimum values detected in the three biological replicates, respectively. The differences between the pre-and post-desiccation treatments were assessed using a two-sided t-test. The significant difference (p < 0.05) is highlighted by an asterisk (*). The exact p-value is 0.03. b, c The correlations between VPH and host abundance in soils pre- and post-desiccation, respectively. The regions shaded in dark gray along the lines represent the 95% confidence level intervals in linear regression. The significance of the regression analysis was determined by an F-test with the adjusted R2 and p-value to estimate the strength of the relationship. Source data are provided as a Source Data file.

