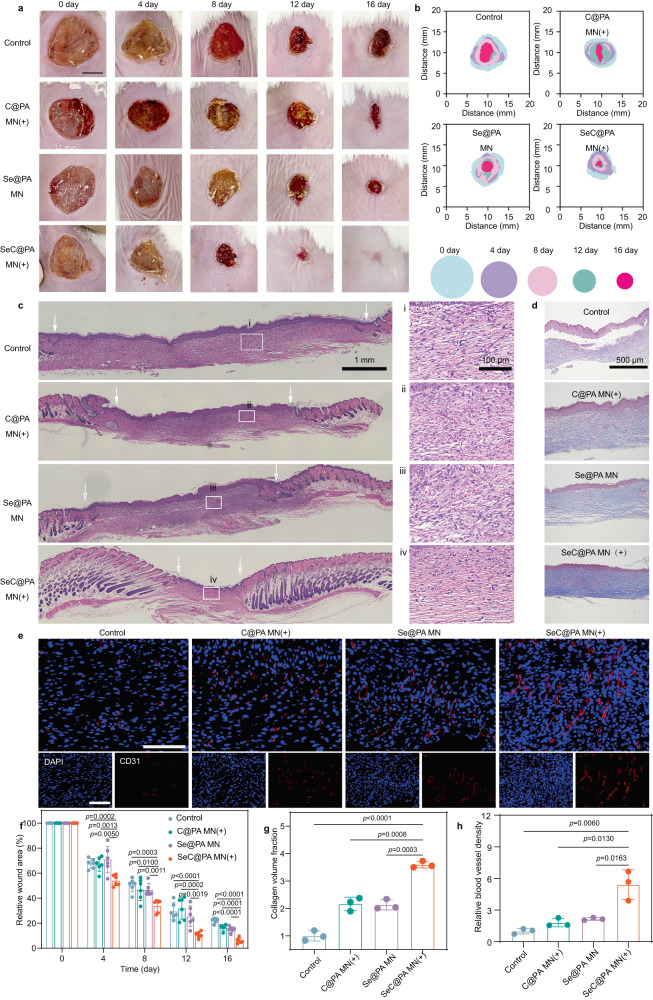
Fig. 8. SeC@PA MN for promoting the healing of biofilm-infected full-thickness diabetic wounds in rats.
a Representative images of wounds during healing. Scale bar is 5 mm. b Schematic diagram of the wound-healing process of the four groups. c Representative H&E staining images of wound samples treated with different groups on day 16. Scale bar is 1 mm. Three independent experiments were performed and representative results are shown. d, g Representative Masson’s trichrome-stained images of wound samples and quantification of the collagen volume fraction for four groups on day 16 (n = 3 biologically independent samples; mean ± SD). Scale bar is 500 μm. e, h Representative immunofluorescence images of CD31 staining in the regenerated skin tissues and quantification of blood vessel density on day 16 after wound treatment (n = 3 biologically independent samples; mean ± SD). Scale bar is 100 μm. f Quantitative data of relative wound area to day 16 of the four groups at different time points (n = 6 biologically independent samples; mean ± SD). Statistical significance was analyzed via one-way ANOVA with a Tukey post-hoc test. Source data are provided as a Source Data file. Control: blank microneedle; C@PA MN(+): microneedle containing Ce6-PDA-LA nanoparticles under 660 nm irradiation (0.2 W/cm2) for 3 min; Se@PA MN: microneedle containing Se-PDA-LA nanoparticles; SeC@PA MN(+): microneedle containing Se-Ce6-PDA-LA nanoparticles under 660 nm irradiation (0.2 W/cm2) for 3 min.

