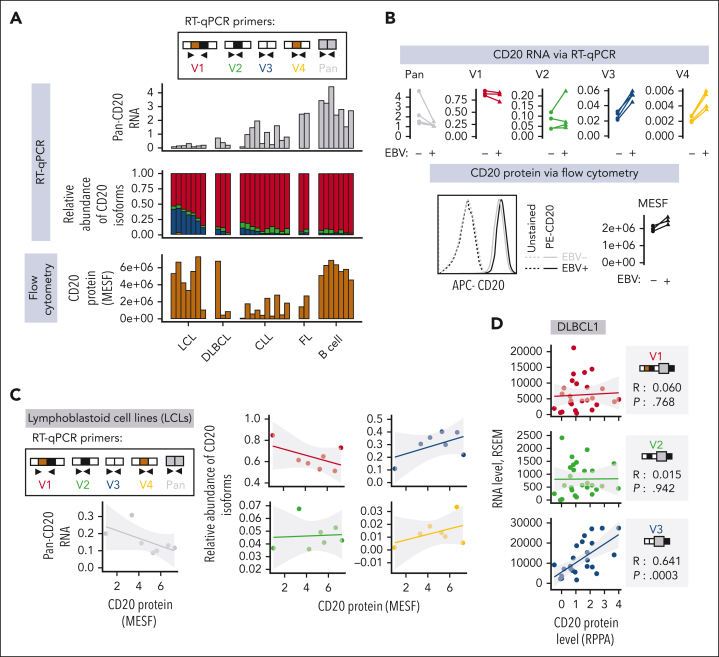
Figure 2.
CD20 protein levels positively correlate with the abundance of V3 and V4 but not V1, V2, or pan-isoform CD20 mRNA. (A-C) Levels of pan-isoform and 5′-UTR variant–specific mRNAs and CD20 protein (expressed as molecules of soluble fluorochrome or MESF) in primary or immortalized human samples. They were quantified using RT-qPCR and flow cytometry, respectively. RNA levels are normalized to those of 3 reference genes: RPL27, B-actin (ACTB), and glyceraldehyde 3-phosphate dehydrogenase (GAPDH). Each bar or point represents data from a single donor. Panel A displays data from EBV-transformed lymphoblastoid B-cell lines (LCLs) and peripheral blood B cells from healthy donors and patients with DLBCL, CLL, or FL. In panel B, peripheral blood B cells from 4 different donors (N = 4) were cultured with the B95.8 strain of EBV (EBV+) or without EBV (EBV−) for 3 days before CD20 expression quantification. (C) Regression analysis of 7 LCL samples from panel A, in which CD20 protein levels are independently correlated with each of the known CD20 mRNA isoforms. (D) A similar regression analysis of 27 DLBCL samples from TCGA consortium for which reverse phase protein array (RPPA) and RNA-seq data are available. The shaded area around the regression line indicates the standard error. The Spearman rank correlation coefficient, R, and the 2-tailed P value, P, as calculated using GraphPad Prism, are shown. APC, allophycocyanin.

