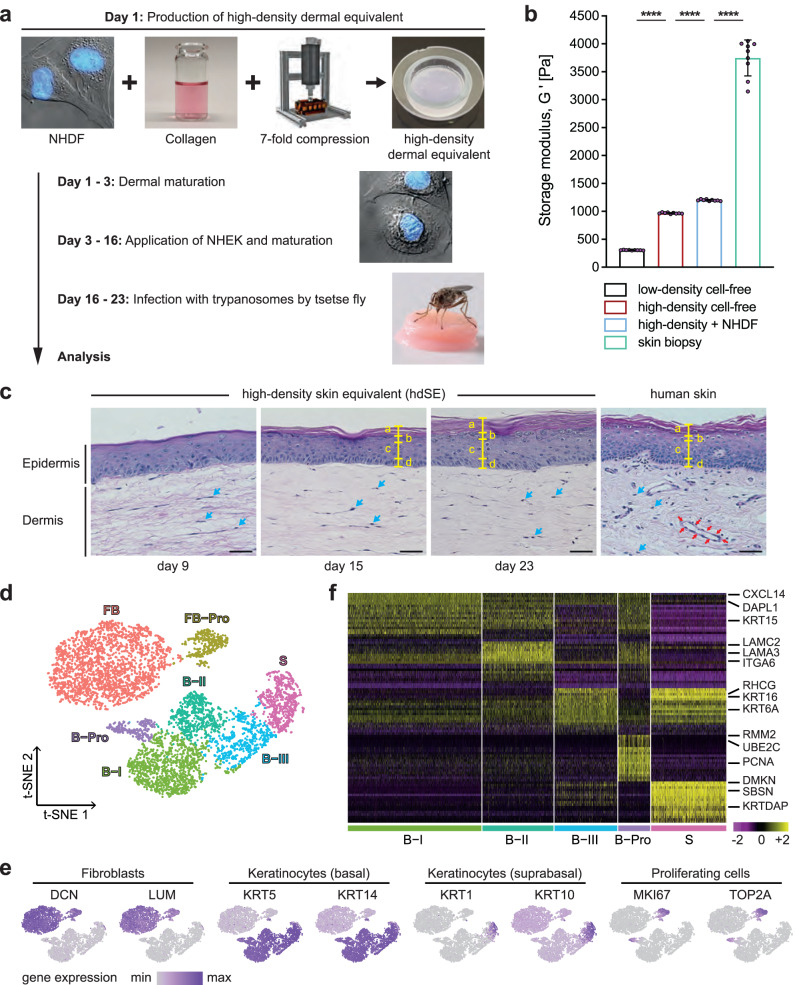
Fig. 1. High-density skin equivalent has improved mechanical properties and recapitulates key aspects of native human skin.
a Normal human dermal fibroblasts (NHDF) were mixed with reconstituted collagen and compressed sevenfold to generate high-density dermal equivalents (hdDEs). Normal human epidermal keratinocytes (NHEK) were added, and the mature high-density skin equivalents (hdSEs) were infected with trypanosomes by tsetse flies. b The storage moduli G′ of NHDF-populated and cell-free, high- and low-density dermal equivalents (ldDEs) as well as human skin biopsies indicate improved mechanical properties of hdDEs. The means ± SD of G′ were calculated from values in the linear viscoelastic region (n = 9, Supplementary Fig. 1d, gray box) determined from at least three individual models/biopsies per condition. Unpaired t-test, two-tailed, **** p < 0.0001. Source data are provided as a Source Data file. c Hematoxylin and eosin-stained cross sections of hdSEs at different culture times in comparison to native human skin. The yellow markings indicate the individual layers of the epidermis: a, stratum corneum; b, stratum granulosum; c, stratum spinosum; d, stratum basale. Blue arrows, NHDF. Red arrows, vascular structure. Scale bar, 40 µm. d t-distributed stochastic neighbor embedding (t-SNE) plot of 5958 cell transcriptomes derived from two hdSEs at day 23. The major populations of cell types were fibroblasts (FB), proliferating fibroblasts (FB-Pro), basal (B-I - III), suprabasal (S), and proliferating keratinocytes (B-Pro). e The expression of fibroblast and keratinocyte markers from basal, suprabasal, and proliferating cells. Normalized gene expression levels for each cell were color-coded from gray to purple and overlaid onto the t-SNE plot. f Heatmap showing the scaled expression levels of the 20 most differentially-expressed genes in each cluster of epidermal keratinocytes. The color key from pink to yellow indicates low to high gene expression levels. Each column represents a single cell, and each row represents an individual gene. Cell-type-specific representative genes are listed to the right.

