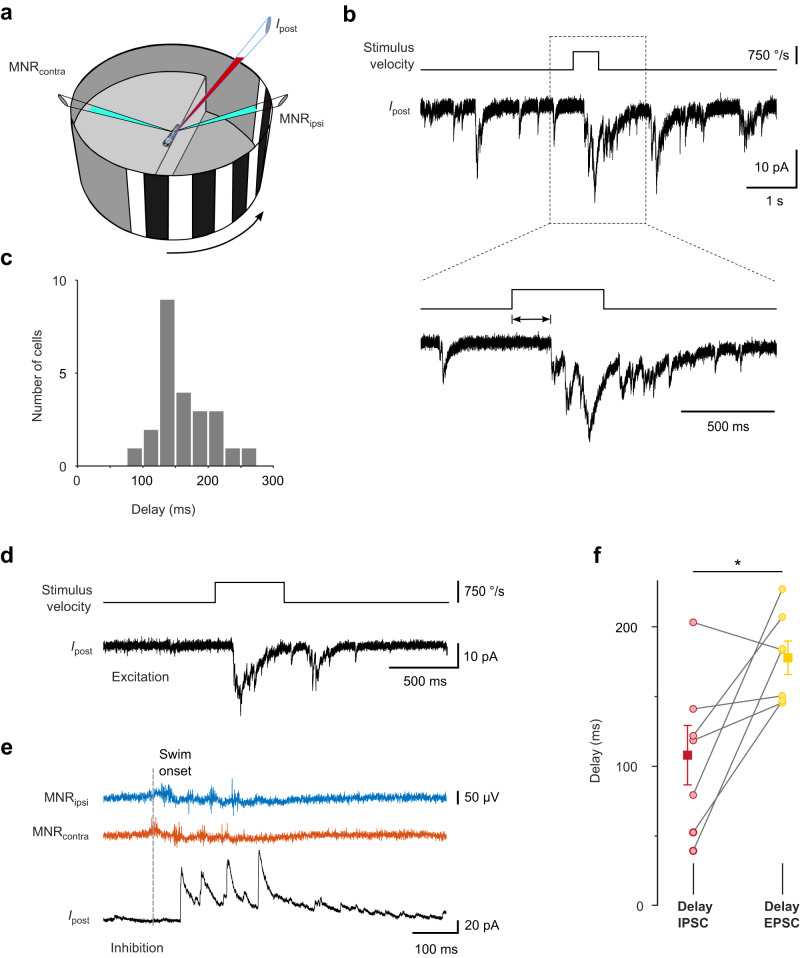
Fig. 5. Delay of excitatory input evoked by fast whole-field motion stimuli.
a Experimental configuration. Excitatory currents were recorded in voltage clamp (holding potential −60 mV) from cell contralateral to the stimulus. A stationary grating was shown, which abruptly moved backward, simulating reafferent whole-field visual motion during discrete swim bouts. b Example recording of EPSCs (Ipost) during presentation of grating, which moved rapidly for 0.5 s (top trace). EPSC delays were measured from onset of stimulus movement (magnified view, bottom traces). c Histogram of delays between stimulus onset and EPSC onset. Individual cell averages from n = 24 cells (161.3 ms ± 8.2 ms; mean ± SEM). d Example recording of moving grating-evoked EPSC (Vhold: −60 mV) in a cell in which also spontaneous swim-related inhibition was measured. e Example recording of IPSC (Vhold: 10 mV) following a spontaneous swim bout. Same cell as in d. f Pairwise comparison of swim-related IPSC delays (red) and delays of EPSCs from the onset of visual grating motion (yellow), measured in the same cells. Individual cell averages from n = 7 cells (circles). Squares and error bars indicate mean ± SEM across cells (EPSC: 178 ms ± 12 ms; IPSC: 108 ms ± 21 ms). Pair-wise difference: 70 ± 25 ms (mean ± SEM, p = 0.047, two-sided Wilcoxon signed-rank test). For analysis of EPSC delays, trials in which the visual stimulus evoked swimming were excluded. Source data are provided as a Source Data file.

