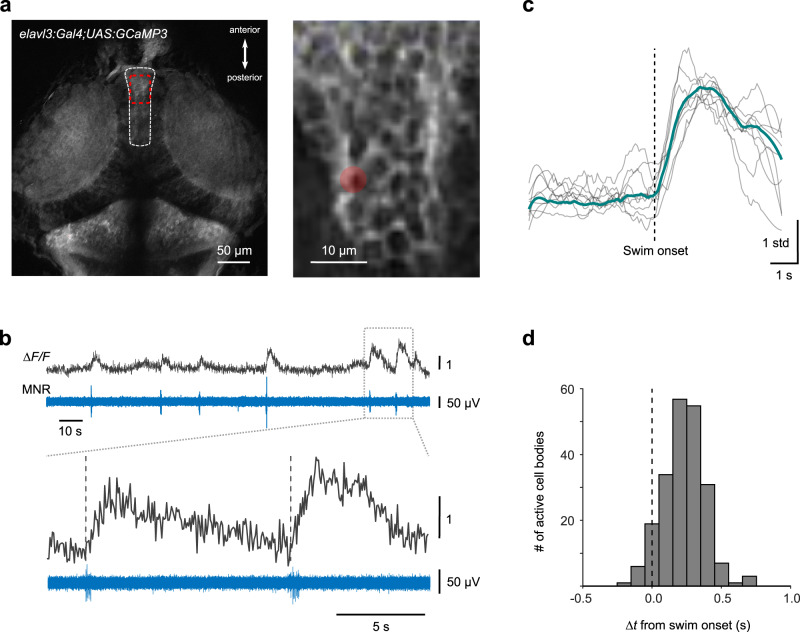
Fig. 7. Temporal distribution of swim-related Ca2+ signals in the torus longitudinalis (TL).
a TL (dashed white outline) in Tg(elavl3:Gal4-VP16;UAS:GCaMP3), (dorsal view). Rapid Ca2+ imaging (8−27 Hz) was performed in a rectangular scan area (red box; magnified view in right inset) during spontaneous fictive swimming in the absence of visual stimulation. Image representative for independent recordings from 5 larvae. b Example of fluorescence transients (ΔF/F) from cell body in the TL (red circle marked in (a, right inset). ΔF/F transients coincide with spontaneous swim bouts, recorded simultaneously (MNR, bottom). Onset of ΔF/F transients occurs around swim onset (vertical dashed lines in magnified view, lower traces). c Swim-triggered average (green trace) of ΔF/F transients from cell shown in b. Individual ΔF/F transients (gray traces) were z-scored prior to averaging. d Histogram of ΔF/F transient delays from swim onset measured in TL cell bodies. (n = 214 cells from 5 larvae). Source data are provided as a Source Data file.

