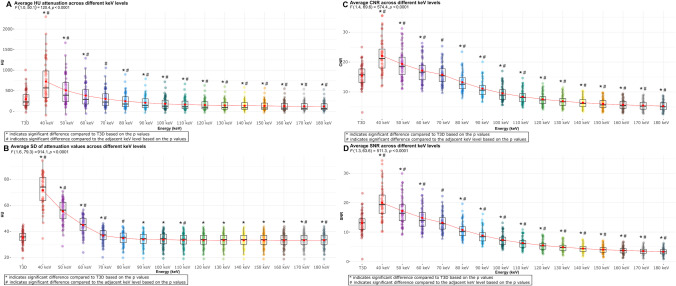
Fig. 2.
Box plots showing the distribution of plaque attenuation and quantitative image quality parameters (SD, CNR, SNR) in different VMI energy levels and T3D images. Panel A depicts the distribution of attenuation values across different energy levels. Panel B depicts the distribution of image noise based on SD across different energy levels. Panel C depicts the distribution CNR across different energy levels. Panel D depicts the distribution SNR across different energy levels. Abbreviations: CNR, contrast-to-noise ratio; HU, Hounsfield unit; SD, standard deviation; SNR, signal-to-noise ratio

