Figure 2.
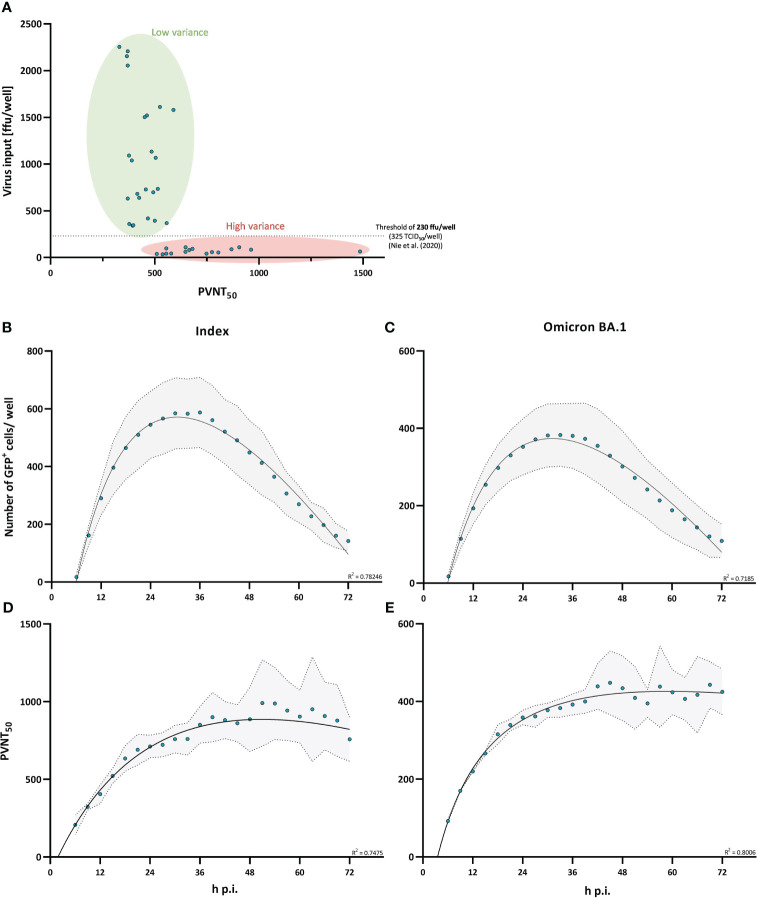
Virus input and infection time affect variance in pseudo-virus neutralization assays. Virus input and infection time were characterized on their ability to affect variance in neutralization assay results. (A) Pseudo-virus neutralization titers (PVNT50) plotted against the actual virus input. Single points present measurements with virus inputs ranging from 30 to 2500 ffu/well. A virus input of 230 ffu/well (approximately 325 TCID50/well) is indicated by the dashed horizontal line which was determined as a threshold for robust regression fit by Nie et al. (30). (B, C) Time-dependent differences in the number of detectable GFP+ cells/well were measured for the index (B) and Omicron BA.1 (C) variant. Single points show the mean measured number of GFP+ cells/well from three independent experiments with the standard deviation shaded in grey. The relationship between the number of GFP+ cells/well and infection time is described by a second order polynomial (quadratic) regression. R-squared values of the regression are provided in the figure. (D, E) Neutralization titers plotted against infection time (h p.i.) for the index (D) and Omicron BA.1-variant (E). Single points show the mean PVNT50 from three independent experiments with the standard deviation shaded in grey. Relationship between PVNT50 and infection time is described by a second order polynomial (quadratic) regression. R-squared values of the regression are provided in the figure.

