Figure 2.
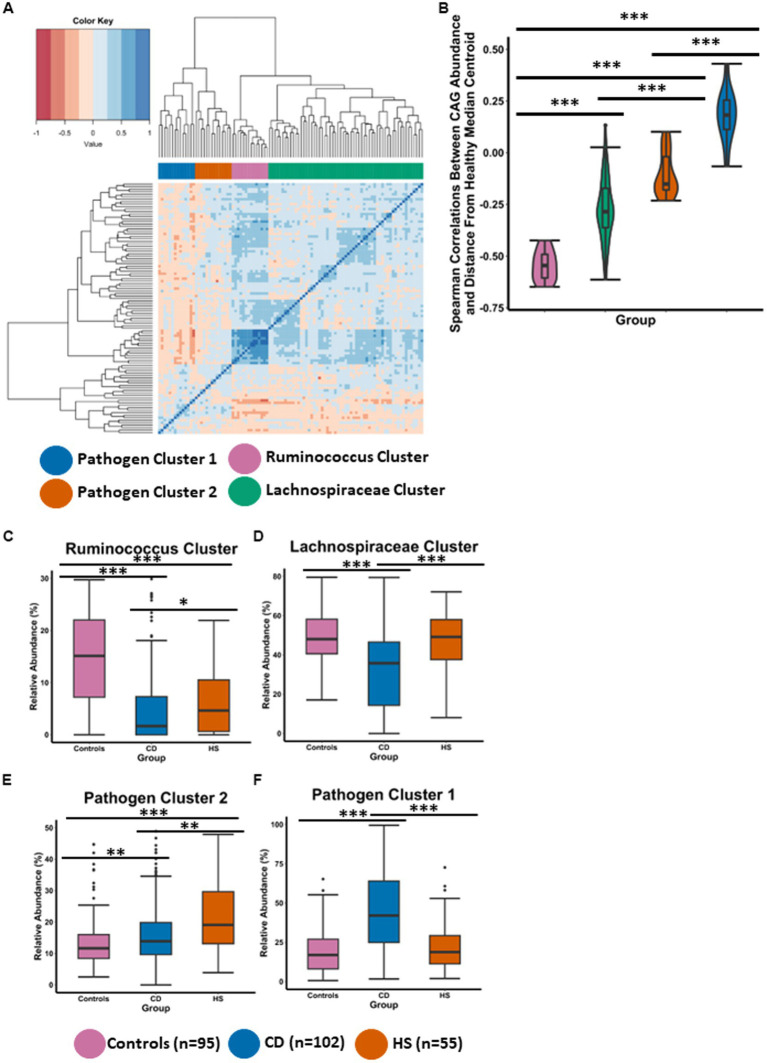
HS and CD are characterised by different distinctive co-abundance group (CAG) microbiota profiles. (A) Heatmap illustrates the ward.d2 clustering of Spearman correlation coefficients representing the relative abundance of genera in the faecal microbiota of individuals included in this study. Each distinct co-abundance group (CAG) is visually distinguished by its corresponding colour as indicated by the legend to the right. (B) Violin plot showing the spearman correlations between CAG abundance and the control median centroid which was previously determined for Figure 1B. (C–F) Boxplots showing the relative abundance (%) of each CAG across the three groups. Statistical significance was calculated using Kruskal-Wallis with Dunn’s post hoc test. The annotations used for p-values are p < 0.05 *; p < 0.01 **; p < 0.001***. All displayed p-values are FDR corrected.

