Figure 6.
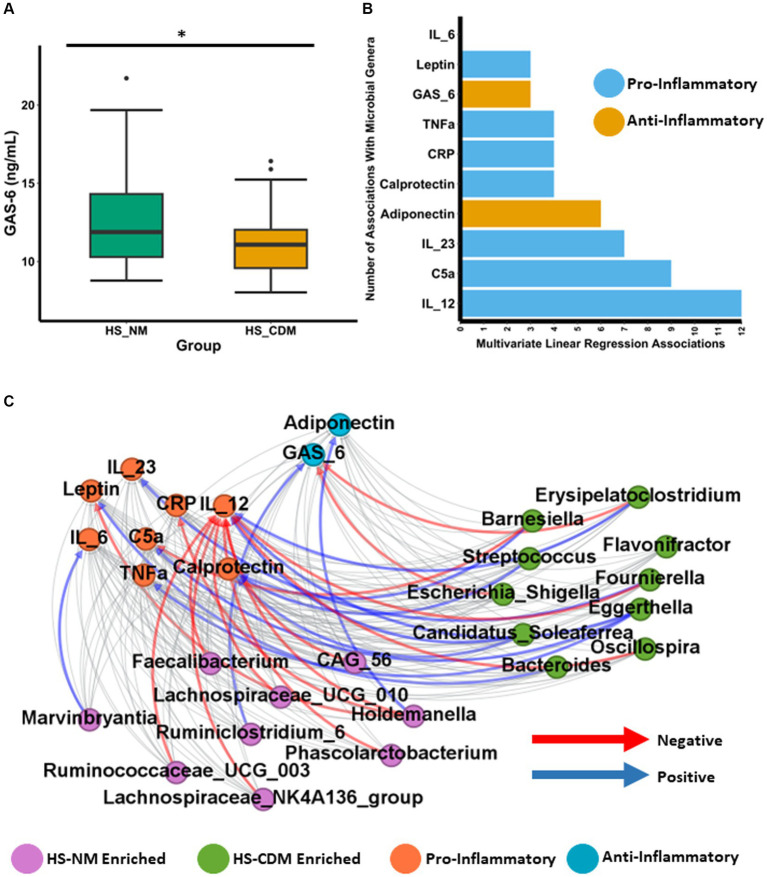
Faecal microbiota in HS associates with an inflammatory phenotype. (A) Boxplot showing the levels of Growth Arrest-Specific 6 (Gas6) in serum of patients with HS. Wilcoxon test was used to determine significance. The annotations used for p-values are p < 0.05 *; p < 0.01 **; p < 0.001***. (B) Barplot showing the number of significant associations (as determined using linear regression) detected between each specific inflammatory marker and general identified as being significantly differentially abundant between the HS-NM and HS-CDM group through ANCOMBC. (C) Network plot showing significant correlations between inflammatory markers and specific genera as determined using CCREPE.

