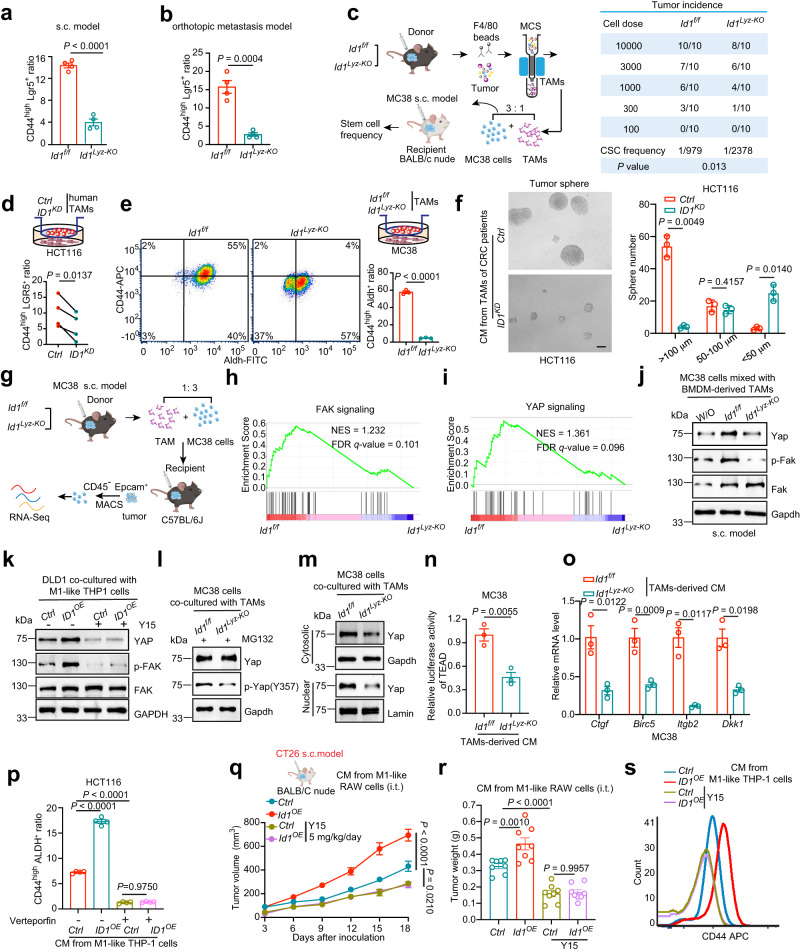
Fig. 4. ID1-expressing TAMs are essential for the maintenance of CRC stemness traits through activating FAK-YAP signaling.
a, b Flow cytometry analysis of CD44high Lgr5+ cell ratio in CD45- Epcam+ tumor cells isolated from MC38-derived tumor nodules (a) in Supplementary Fig. 2a or CT26-derived liver metastases (b) presented in Fig. 2l, n = 4 biologically independent samples, Student’s t-test. c Schematic diagram for determining the tumor initiation capacity and the statistical data of CSC frequency. d Flow cytometry analysis of CD44high LGR5+ cell ratio in HCT116 cells cocultured with Ctrl or ID1KD TAMs, n = 4 patients, paired t-test. e Flow cytometry analysis of CD44high Aldh+ cell ratio in different groups of MC38 cells, n = 3 biologically independent samples, Student’s t-test. f Images and quantification of HCT116 tumor spheres with different treatments, n = 3 biologically independent samples, Welch’s test. g Schematic diagram for the transcriptome sequencing. h, i GSEA analysis on differentially expressed genes between CD45- Epcam+ tumor cells of indicated groups presented in (g) with a predefined gene set of FAK (h) and YAP signaling (i). n = 3 biologically independent samples per group in the RNA-seq data. j Immunoblots of indicated proteins in different groups of CD45- Epcam+ tumor cells presented in Supplementary Fig. 1e, n = 3 biologically independent samples. k Immunoblots of indicated proteins in DLD-1 cells cocultured with different THP-1 cells with or without Y15 treatment, n = 3 biologically independent samples. l Immunoblots of indicated proteins in MC38 cells with different treatments, n = 3 biologically independent samples. m Immunoblots of cytosolic and nuclear Yap in MC38 cells cocultured with different TAMs, n = 3 biologically independent samples. n Relative luciferase activity of TEAD in MC38 cells cocultured with different TAMs, n = 3 biologically independent samples, Student’s t-test. o Relative mRNA expression of Yap downstream genes in different groups of MC38 cells, n = 3 biologically independent samples, Student’s t-test. p Effects of Verteporfin on CD44high ALDH+ ratio of HCT116 cells cocultured with different groups of THP-1 cells, n = 3 biologically independent samples. q Schematic diagram for tumor model (q, up) and tumor volumes (q down) of the indicated groups, one-way ANOVA test, n = 12, 10, 10, and 8 mice in the groups of Ctrl, Id1OE, Ctrl-Y15, Id1OE-Y15. r Schematic diagram for tumor weight of the indicated groups, n = 8 mice per group, one-way ANOVA test. s Effects of Y15 on CD44 expression of DLD-1 cells cocultured with different groups of THP-1 cells, n = 3 biologically independent samples. c, g, and q are created with BioRender.com. Source data are provided as a Source Data file.

