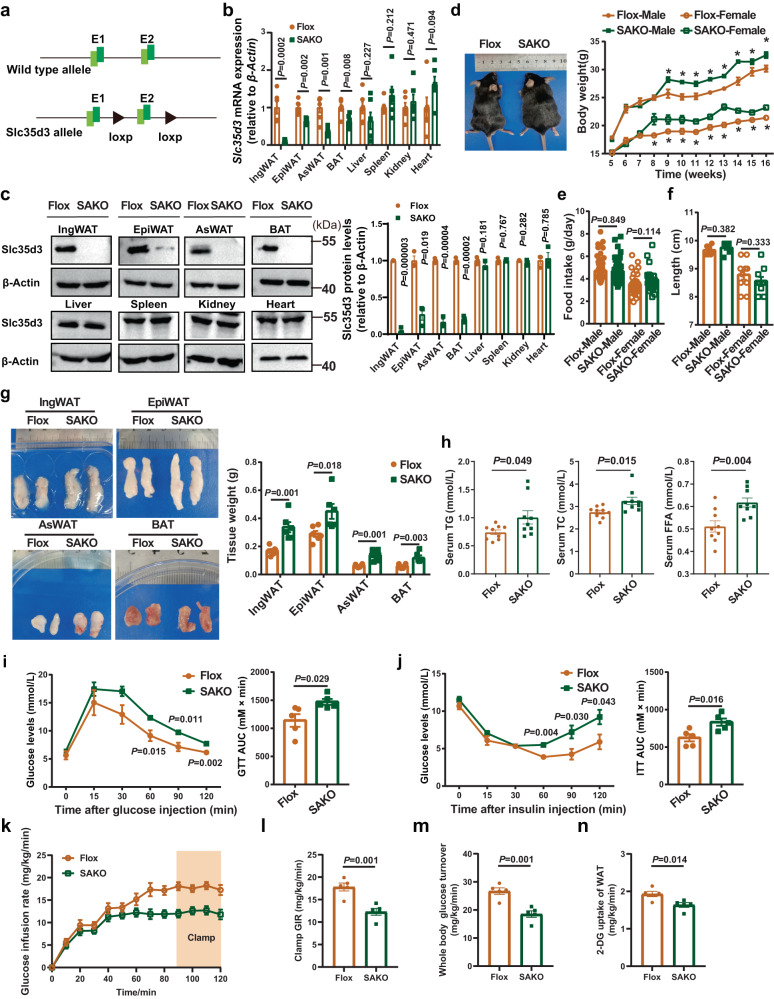
Fig. 2. Adipose-specific Slc35d3 knockout induced obesity in mice.
a Schematic diagram showing the generation of Slc35d3 flox mice. b qPCR analysis of Slc35d3 expression in different tissues from SAKO (n = 6) and Flox (n = 6) mice. c Western blot results of Slc35d3 expression in different tissues from SAKO (n = 3) and Flox (n = 3) mice. Right panel, summary of the quantification of three independent experiments. d Body weight curve of SAKO and Flox mice (n = 11 per group). P = 0.011, 0.0003, 0.004, 0.00005, 0.0002, 0.0001, 0.036, 0.006 for male SAKO mice and controls from 9 to 16 weeks; P = 0.010, 0.018, 0.021, 0.0003, 0.007, 0.00008, 0.0004, 0.001, 0.004 for female SAKO mice and controls from 8 to 16 weeks. e Food intake of SAKO (male, n = 44; female, n = 30) and Flox (male, n = 44; female, n = 30) mice on an NCD. f Body length of SAKO mice and Flox mice (male, n = 7 per group; female, n = 10 per group). g Representative images and quantification of fat pad weights (n = 6 per group). h Serum lipid profiles (TG, TC, and FFA) in SAKO (n = 9) mice and controls (n = 9). i, j Blood glucose concentrations during IP-GTT (i) and IP-ITT (j) in SAKO mice and their controls (n = 5 per group). The area under the curve (AUC) values are shown. k–n Glucose infusion rates (k, l), whole-body insulin-stimulated glucose turnover (m) and 2-deoxyglucose (2-DG) uptake in IngWAT (n) during hyperinsulinemic–euglycemic clamps of NCD-fed SAKO (n = 5) and Flox (n = 5) mice. Values are the fold induction of gene expression normalized to the housekeeping gene β-Actin (b, c). Data are expressed as the mean ± SEM. Statistical significance was assessed by unpaired two-sided Student’s t test (b, c, e–h, l–n) or two-way ANOVA followed by Bonferroni’s multiple comparisons test (d, i, j). The exact P values are shown in the figure or corresponding legends; *P < 0.05. EpiWAT epididymal white adipose tissue, BAT brown adipose tissue, IngWAT inguinal white adipose tissue, AsWAT anterior-subcutaneous white adipose tissue, SAKO Slc35d3 adipocyte-specific knockout, TG triglyceride, TC total cholesterol, FFA free fatty acid. Source data are provided as a Source Data file.

