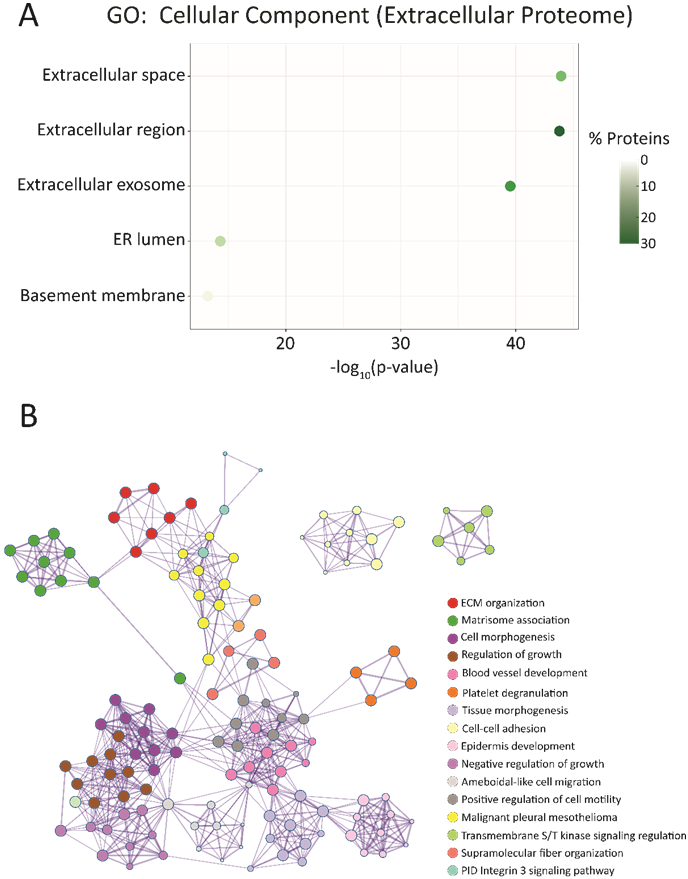
Figure 4.

Functional annotation and enrichment analyses for the significantly upregulated proteins in the extracellular proteome fraction relative to their intracellular counterpart. A. Gene Ontology (GO) analysis of the significantly upregulated proteins within the extracellular proteome. The top 5 enriched cellular components are plotted above, with plot colors indicating the percentage of proteins mapped to a particular process out of the 647 total upregulated proteins. B. Visualization of enrichment analyses and how these various components interconnect to impact the entire system. All mapping was performed using Metascape, and proteins used to generate the protein interaction network pertain to those significantly enriched within the extracellular proteome samples. Listed processes and annotations are in order from most to least significant by Benjamini-Hochberg corrected p-value.
