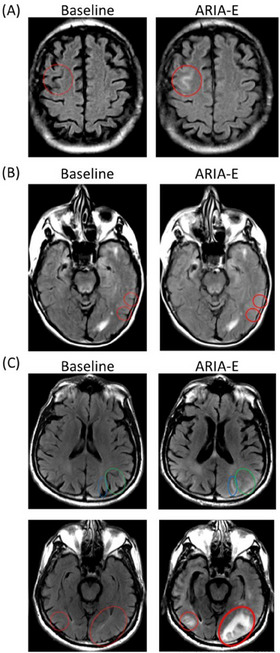
FIGURE 2.

Example of baseline and ARIA‐E images provided to readers with sulcal hyperintensities (A), sulcal effacement/swelling (B), and parenchymal hyperintensities (C). (A) Typical purely sulcal hyperintensity, resulting from proteinaceous content leakage within the sulcus without significant impact on brain parenchyma or effacement of adjacent sulci. (B) Sulcal effacement in the left parietal lobe on two consecutive slices, without significant associated parenchymal or sulcal hyperintensity. Such a pattern is uncommon as it is very hard to detect. Diagnostic confidence is increased here by the confirmation on adjacent slices and use of image registration to remove bias from repositioning and partial volume effect. (C) Sulcal hyperintensity (blue oval) accompanied by overall swelling causing sulcal effacement (green oval). Parenchymal hyperintensity (bilaterally, red oval). Brain sulci are no longer visible in the vicinity, due to swelling. ARIA‐E, amyloid‐related imaging abnormalities–edema.
