
FIGURE 5.
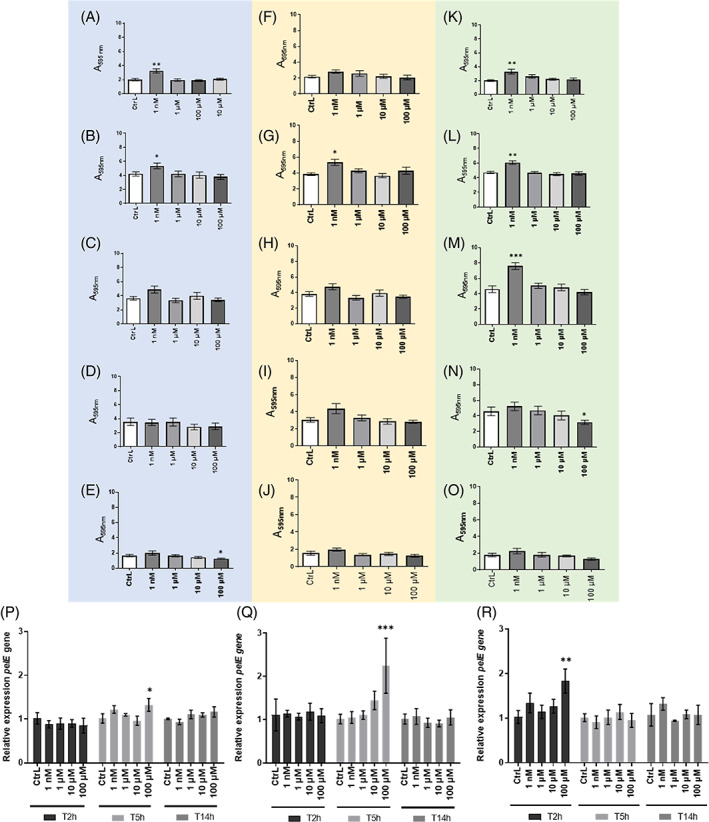
Effect of endocrine disruptors on the biofilm formation of P. aeruginosa. (A‐O) Biofilm formation was assessed in the presence of EDs according to three modes of exposure: exposure to EDs only planktonic culture (blue background), recovered and adjusted to an A600nm value of 0.05 and placed in plates BPA (A), DBP (B), EP (C), MP (D), TCS (E). Continuous exposure to EDs during planktonic culture and during biofilm formation (orange background) BPA (F), DBP (G), EP (H), MP (I), TCS (J). Exposure to EDs only at the time of biofilm formation (green background) BPA (K), DBP (L), EP (M), MP (N), TCS (O). Biofilms formed were quantified by CV staining and results are presented as mean ± SEM of triplicate. Statistical analysis was performed using nonparametric Kruskal–Wallis test, * p < 0.05; ** p < 0.01; *** p < 0.001. (P)–(R) Relative expression of virulence gene pelE of P. aeruginosa after exposure to (P) BPA, (Q) EP or (R) TCS. P. aeruginosa was cultured in LB medium at 37°C under agitation in presence or not of 1 nM, 1, 10, and 100 μM of EDs. Bacterial pellets were harvested at T = 2 h, T = 5 h, and T = 14 h mimicking the growth phases. Results are presented as mean ± SEM of triplicate. Statistical analysis was performed using 2Way ANOVA, * p < 0.05; ** p < 0.01; *** p < 0.001, **** p < 0.0001.