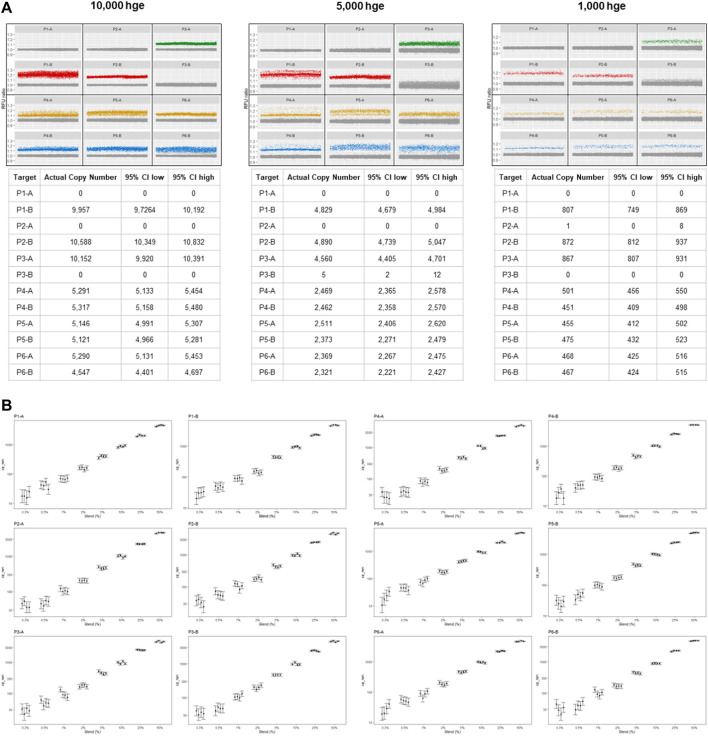
FIGURE 2.
mdPCR assay results. (A) Representative data plots and tables from reactions containing 10,000, 5,000, and 1,000 human genomic equivalents from a single individual. Within each partition, 12 targets were simultaneously detected, and Poisson statistics were used to quantify each target in each reaction. For each locus (P1—P6) there were two alleles which were designated (A, B). Partitions below a pre-determined positive RFU ratio were considered to have no target and are shown as gray points which are near 1.0. Partitions above a pre-determined positive RFU ratio were defined as positive and have a different color for each channel (green, red, yellow, blue). (B) mdPCR assay results for 12 targets, minor fraction 0.3%–50%. The graphs (on log10 scales) show the number of copies for each minor allele that was detected for each probe (P1-A—P6-B). The results ranged from 30 to 5,000 copies for each of the four reactions. These experiments were carried out using mixtures of two human genomic DNA samples containing minor fractions of each allele at 0%, 0.3%, 0.5%, 1%, 2%, 5%, 10%, 25% or 50%. Four replicates of each sample were tested. DNA input was 10, 000 hge (33.3 ng of DNA). Error bars represent the 95% confidence interval. The CVs for these measurements are provided in Supplementary Datasheet S2.

