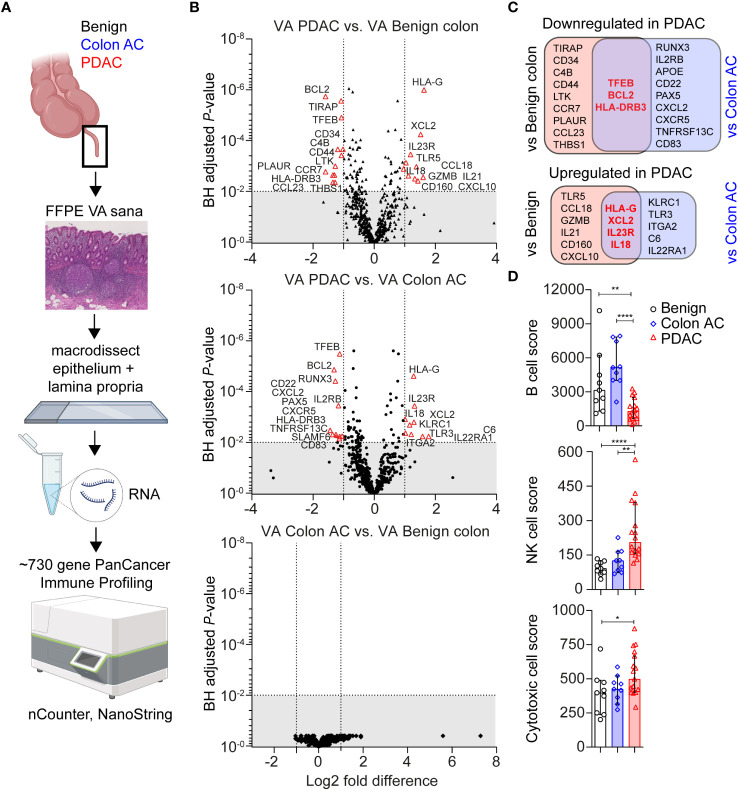
Figure 1.
Transcriptomic immune profiles of the vermiform appendix (VA) among three adult patient groups. (A) Schematic overview of immune profiling using formalin-fixed paraffin-embedded (FFPE) healthy VA (termed sana) from patients with benign colon disease (n = 9); colon adenocarcinoma (AC) (n = 9); or pancreatic ductal adenocarcinoma (PDAC) (n = 16). The gut-associated lymphoid tissue (GALT) was macrodissected from tissue slides, and immune-related gene expression was quantified using the PanCancer Immune Profiling Panel (NanoString). This figure was created with BioRender.com. (B) Volcano plot illustrating differentially expressed (DE) genes in three patient group comparisons (│Fold difference│ ≥ 2, Benjamini–Hochberg-adjusted p-value <0.010 cut-off indicated by the gray area). (C) Venn diagrams showing the overlap in PDAC-related DE genes compared to benign colon disease or colon AC. Overlapping PDAC-specific genes are in bold and red. (D) Median cell type scores in VA in the three patient groups, based on nSolver-assigned immune cell-specific gene expression. Error bars are 95% confidence intervals (CI); p-values are calculated using the Mann–Whitney U test. * p < 0.050; ** p < 0.010; **** p < 0.0001.

