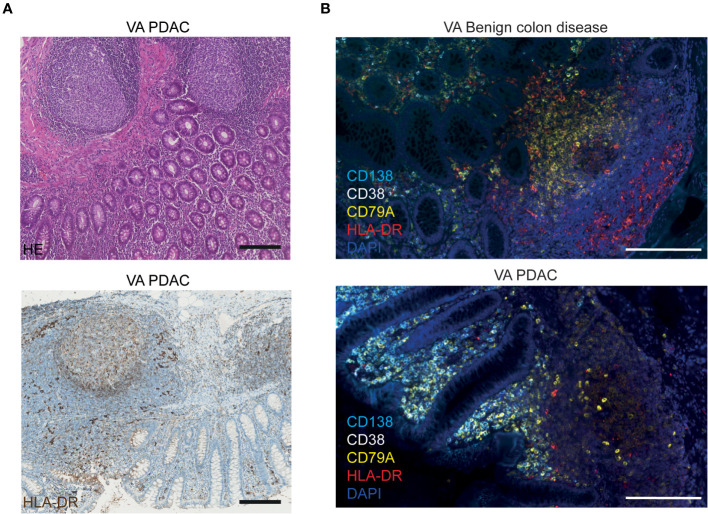
Figure 3.
Visualization of HLA-DR protein expression in VA. (A) Representative images of FFPE VA tissue sections from a PDAC patient stained with HE (upper image) or with hematoxylin and an HLA-DR antibody visualized with DAB (lower image). Scale bars = 200 µm. (B) Fluorescence images of VA tissue slides from a benign colon disease patient (upper image) and from a PDAC patient (lower image), stained with antibodies against HLA-DR (red), CD138 (aqua blue, plasma cells), CD38 (white, plasma cells), CD79A (yellow, all B cells), and DAPI (navy blue, nuclei). Scale bars = 200 µm.

