
Figure 7.
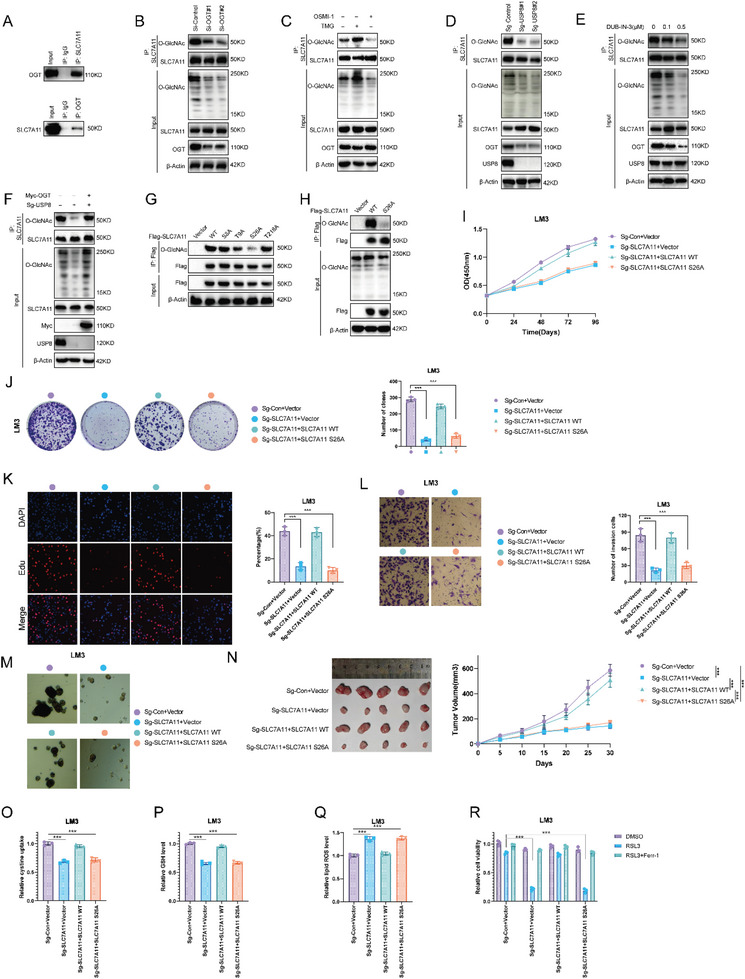
OGT O‐GlcNAcylated SLC7A11 at Ser26 in HCC cells. A) Co‐IP assay reveals an association between endogenous OGT and SLC7A11 in LM3 cells. LM3 cells were harvested with RIPA lysis buffer. Co‐IP was performed using antibody as indicated. B) Depletion of OGT decreased the O‐GlcNAcylation of SLC7A11. SLC7A11 was immunoprecipitated with anti‐SLC7A11 and O‐GlcNAcylated SLC7A11 was immunoblotted with anti‐O‐GlcNAcylation. C) Western blot showing TMG (10 µm, 24 h) and OSMI‐1 (50 µm, 24 h) treatment regulates SLC7A11 O‐GlcNAcylation level. D) Depletion of USP8 decreased the O‐GlcNAcylation of SLC7A11. E) DUB‐IN‐3 treatment decreased the O‐GlcNAcylation of SLC7A11. F) USP8 regulated the O‐GlcNAcylation of SLC7A11 through OGT. G,H) SLC7A11 was O‐GlcNAcylated at serine 26 in cells. 293T cells were transfected with the indicated plasmids, and SLC7A11 O‐GlcNAcylation was analyzed by immunoprecipitation with anti‐FLAG antibody and western blot with the indicated antibodies. I) CCK8 assays of LM3 cells. J) Colony formation assays of LM3 cells K) Edu assays of LM3 cells. L) Cell invasion assay of LM3 cells. M) Sphere formation assay of LM3 cells. N) In vivo xenografts generated from LM3 cells transfected with the indicated plasmids. HCC cells (1 × 10⁶) were injected into the right dorsal flank of each mouse. Tumor sizes were measured every 5 days until the end of the experiment. O–Q) Cystine, GSH, and lipid ROS levels were quantified in LM3 cells. R) CCK8 assay showing the response of LM3 cells to RSL3 (10 µM)±ferrostatin (1 µm). Results shown are representative of three independent experiments. Data are represented as mean ± SD of biological triplicates.*p value < 0.05; **p value < 0.01; and ***p value < 0.001.