
Figure 2.
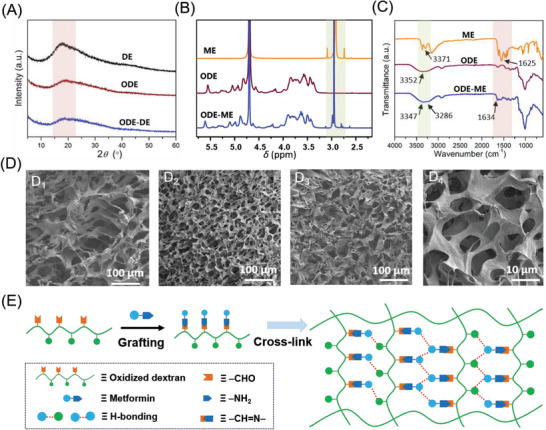
A) XRD of the DE, ODE, and ODE–ME samples. B) 1H NMR and C) FTIR spectra of the ME, ODE, and ODE–ME samples. D) SEM images of (D1) ODE, (D2) ODE–ME (10 wt.%), and (D3 and D4) ODE–ME (15 wt.%). E) ODE–ME hydrogel formation.
Official websites use .gov
A
.gov website belongs to an official
government organization in the United States.
Secure .gov websites use HTTPS
A lock (
) or https:// means you've safely
connected to the .gov website. Share sensitive
information only on official, secure websites.
A) XRD of the DE, ODE, and ODE–ME samples. B) 1H NMR and C) FTIR spectra of the ME, ODE, and ODE–ME samples. D) SEM images of (D1) ODE, (D2) ODE–ME (10 wt.%), and (D3 and D4) ODE–ME (15 wt.%). E) ODE–ME hydrogel formation.