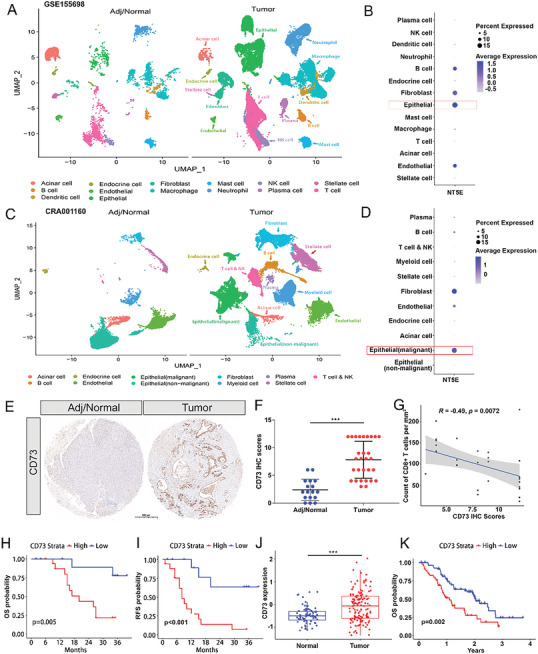
Figure 1.

Human CD73 levels are upregulated in pancreatic cancer cells and correlate with survival. A) The distribution of defined cell clusters comparing three human adjacent/normal pancreas and 16 treatment‐naive PDAC tumors at the time of sample acquisition was shown by UMAP plots in the GSE155698 dataset. B) Dot plot of NT5E expression, the gene encoding CD73, in all identified cell clusters in the GSE155698 dataset C) the distribution of defined cell clusters comparing 11 human adjacent/normal pancreas and 24 treatment‐naive PDAC tumors at the time of sample acquisition was shown by UMAP plots in the CRA001160 dataset. D) Dot plot of NT5E expression, the gene encoding CD73, in all identified cell clusters in the CRA001160 dataset. E) Representative images of IHC staining of CD73 in human adjacent/normal pancreas and PDAC tumors. Scale bar: 500 µm. F) Quantification and statistical analysis of the above IHC staining of CD73 in 17 human adjacent/normal pancreas and 29 PDAC tumors without any treatment. CD73 IHC scores were compared between the two groups using the Mann–Whitney test. *** p < 0.001 G) Correlation analysis of tumor‐infiltrating CD8+ T cell and CD73 IHC scores via Spearman correlation coefficients. H,I) Kaplan–Meier curves showing overall survival (H) and recurrence‐free survival (I) of patients with 29 PDAC stratified by CD73 IHC scores. p‐values are from log‐rank tests. J) Comparison of CD73 protein levels between 75 normal pancreas and 140 treatment‐naive PDAC tumors in the CTPAC dataset via Student's t‐test. *** p < 0.001. Data presented as mean ± SD. K) Kaplan–Meier analysis for overall survival in 140 PDAC patients according to CD73 protein level via the log‐rank test.
