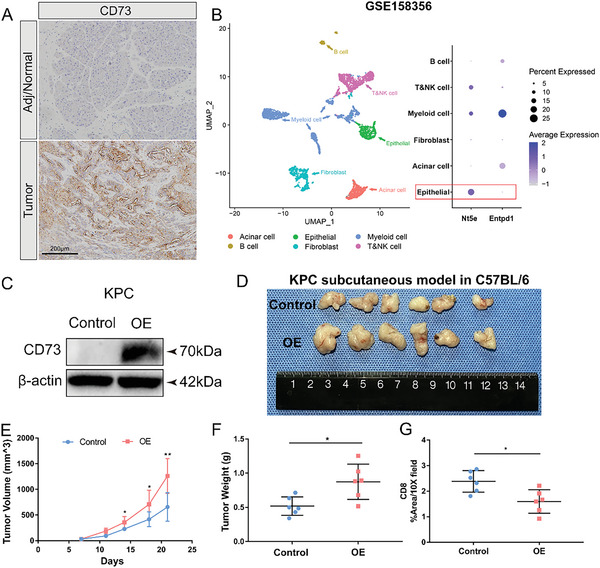
Figure 2.

Overexpression of CD73 in murine tumor cells contributes to tumor growth in vivo. A) Representative images of immunohistochemistry staining of CD73 in murine adjacent/normal pancreas and orthotopic allografts of a KPC cell line. Scale bar: 200 µm. B) UMAP visualization of six identified cell populations and dot plot of Nt5e and Entpd1 expression in these populations in the single‐cell RNA‐sequencing dataset GSE158356 of two orthotopic allografts of a KPC cell line. C) Western blot analysis for CD73 in CD73 overexpressing (OE) and control KPC cells. D–F) Image (D), volumes (E), and weights (F) of the CD73 OE versus Control KPC tumors (n = 6 samples per group). Tumor volumes and weights were compared between Control and OE groups. Values are means ± SD, * p < 0.05, ** p < 0.01 in a two‐sample t‐test. G) Quantification and comparison of immunohistochemistry result of CD8+ T cells in the CD73 OE versus Control KPC tumors (n = 6 samples per group). * p < 0.05, ** p < 0.01 in Student's t‐test. Data presented as mean ± SD.
