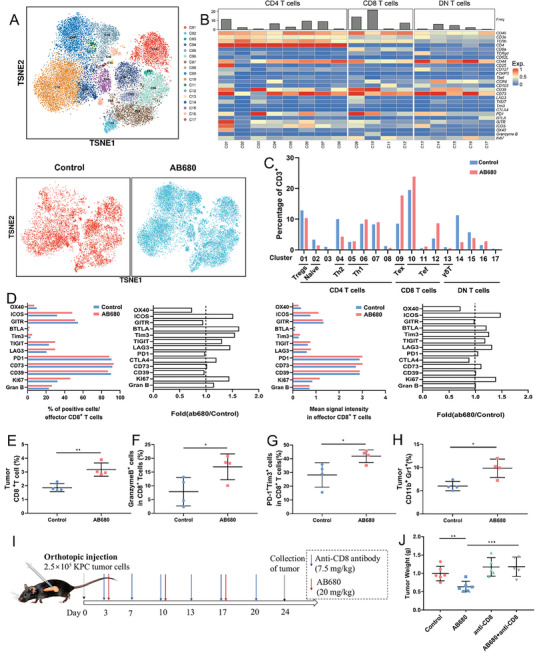
Figure 4.

AB680 reprograms the tumor microenvironment and exerts an antitumor response dependent on CD8+ T cells. A) The t‐distributed stochastic neighbor embedding (t‐SNE) plot of CD3+ tumor‐infiltrating lymphocytes of the total six samples, control and AB680‐treated samples. B) Heatmap indicating the expression of markers specific for identifying differentiation, activation, and exhaustion status of T cells in 17 clusters. C) The frequencies of each cell cluster among the CD3+ cells in the two groups. D) The expression of immune checkpoints, Ki‐67, and Granzyme B in the tumor‐infiltrating CD8+ T cells from control mice or mice treated with AB680. E–H) The percentages of CD8+ T cells (E), Granzyme B+ (F), and PD1+TIM3+ cells (G) among the total CD8+ T cells, and MDSCs (H) in control and AB680‐treated KPC orthotopic allografts determined by flow cytometry (n = 4 samples per group). Data presented as mean ± SD, *p < 0.05, **p < 0.01 in Student's t‐test. I) Schematic representation of the therapy schedule for AB680 and anti‐CD8 antibody in the KPC orthotopic model. J) The weight of the orthotopic KPC allografts from the Control (n = 6), AB680(n = 6), anti‐CD8(n = 5), and AB680+anti‐CD8(n = 5) groups. ** p < 0.01, *** p < 0.001 in Student's t‐test. Data presented as mean ± SD.
