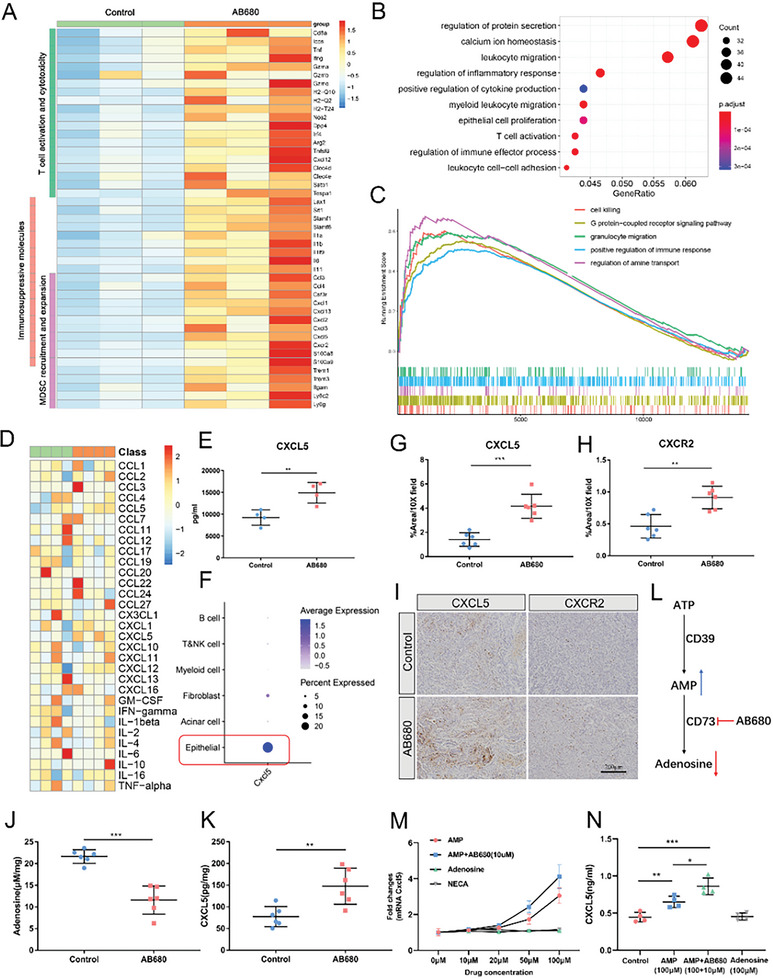
Figure 6.

AB680 regulates CXCL5 released by tumor cells and promotes MDSC accumulation. A) Heatmap of immune‐related differential genes in the RNA‐seq data of control and AB680‐treated tumors (n = 3 samples per group). B,C) Over‐Representation Analysis B) and Gene Set Enrichment Analysis (C) of the above RNA‐seq data. D) Heatmap of 23 different mouse cytokine expression levels in serums obtained at the time of tumor collection, as shown in Figure 3E using Bio‐Plex Pro Mouse Cytokine 23‐plex immunoassay (n = 4 samples per group). E) The protein level of CXCL5 in mouse serums from the indicated treatment groups. Data presented as mean ± SD, ** p < 0.01 in Student's t‐test. F) Dot plot of Cxcl5 expression in the identified populations in the single‐cell RNA‐sequencing dataset GSE158356 of two orthotopic KPC allografts. G,H) Quantification of CXCL5 and CXCR2% positive area in the AB680‐treated versus Control KPC tumor at the endpoint (n = 6 samples per group). ** p < 0.01, *** p < 0.001 in the Student's t‐test. Data presented as mean ± SD. I) Representative images of immunohistochemistry staining of CXCL5 and CXCR2 in the KPC tumors from the indicated treatment groups. J,K) The level of adenosine and CXCL5 protein in the AB680‐treated versus Control KPC tumor at the endpoint (n = 6 samples per group). ** p < 0.01, *** p < 0.001 in Student's t‐test. Data presented as mean ± SD. L) Schematic representation of the changes in adenosine metabolism after inhibition of CD73 activity by AB680. M) qRT‐PCR analysis of Cxcl5 mRNA expression in the KPC cells with different concentrations of AMP, adenosine, and the adenosine receptor agonist NECA at 0, 10, 20, 50, and 100 µm (n = 3). Data presented as mean ± SD. N) The CXCL5 protein concentration in the culture supernatant was evaluated by ELISA in the KPC cells with indicated concentrations of drugs (n = 3). Data presented as mean ± SD. * p < 0.05, ** p < 0.01, *** p < 0.001 in Student's t‐test.
