Figure 2.

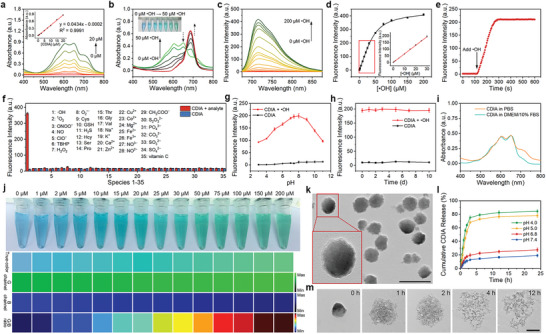
In vitro detection of •OH using CDIA. a) UV–vis–NIR absorption spectra of CDIA with different concentrations. Inset: The standard curve of CDIA determined by measuring the absorbance at 650 nm. b) UV–vis–NIR absorption spectra of CDIA (10 µm) in the absence or presence of •OH with different concentrations in PBS (10 mm, pH 7.4) at 37 °C. Inset: The corresponding white light images in the absence or presence of different concentrations •OH. c) Fluorescence spectra of CDIA (10 µm) in the absence or presence of •OH with different concentrations. d) Fluorescence intensity of CDIA as a function of •OH concentration. Inset: Linear correlation between the fluorescence intensity and •OH concentration. All measurements were acquired in PBS (10 mm, pH 7.4) at 37 °C, λex/em = 650/720 nm. e) Time‐dependent fluorescence changes of 10 µM CDIA towards 100 µm •OH in PBS buffer (10 mm, pH 7.4) at 37 °C. f) Fluorescence responses of 10 µm CDIA toward various analytes: 1) 100 µm •OH; 2) 100 µm 1O2; 3) 100 µm ONOO−; 4) 100 µm NO; 5) 100 µm ClO−; 6) 100 µm TBHP; 7) 100 µm H2O2; 8) 30 µm O2•−; 9) 5 mm Cys; 10) 5 mm GSH; 11) 100 µm H2S; 12) 100 µm Hcy; 13) 100 µm Ser; 14) 100 µm Pro; 15) 100 µm Thr; 16) 100 µm Gly; 17) 100 µm Val; 18) 100 µm Na+; 19) 100 µm K+; 20) 100 µm Ca2+; 21) 100 µm Zn2+; 22) 100 µm Cu2+; 23) 100 µm Co2+; 24) 100 µm Mg2+; 25) 100 µm Fe2+; 26) 100 µm Fe3+; 27) 100 µm NO3−; 28) 100 µm NO2−; 29) 100 µm CH3COO−; 30) 100 µm S2O32−; 31) 100 µm PO43−; 32) 100 µm CO32−; 33) 100 µm SO32−; 34) 100 µm SO42−; 35) 100 µm vitamin C. g) Effect of pH on the fluorescence of CDIA (10 µm) in the absence or presence of 100 µM •OH in PBS buffer (10 mm, pH 7.4) at 37 °C. h) Fluorescence intensity of CDIA for long‐term‐stability study. i) UV–vis–NIR absorption spectra of stability study of CDIA in PBS or DMEM with 10% FBS. j) True‐color and G/B ratio images calculated of the green‐ and blue‐ channels at different •OH concentrations from 0 to 200 µm. k) TEM image of CDIA@LMWC NP. Scale bar: 100 nm. l) In vitro release profile of CDIA from CDIA@LMWC NP at different pH conditions. m) TEM images of CDIA@LMWC NP in PBS buffer (10 mM, pH 5.0) at different time points. Scale bar: 50 nm. Data represent mean ± SD (n = 5).
