Figure 3.

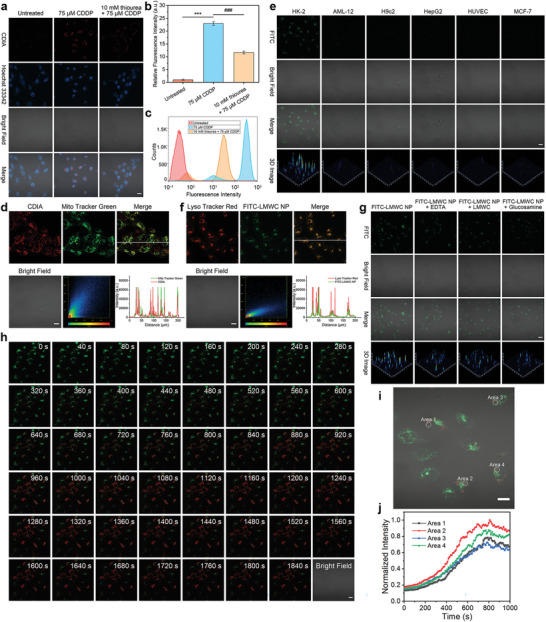
Imaging •OH fluxes in living cells with CDIA. a) Confocal fluorescence imaging of HK‐2 cells with untreated, 75 µm CDDP or pre‐treated with 10 mm thiourea for 2 h before 75 µm CDDP for 24 h, then incubated with 10 µm CDIA at 37 °C for 30 min. b) Fluorescence intensity plots of HK‐2 cells for different groups. Data represent mean ± SD (n = 5), * P < 0.05, ** P < 0.01, *** P < 0.001, #P < 0.05, ##P < 0.01, ###P < 0.001; one‐way ANOVA with multiple comparisons test. c) Flow cytometric assays of HK‐2 cells for different groups. d) Confocal fluorescence images of 150 µm CDDP‐treated HK‐2 cells co‐stained with CDIA and Mito Tracker Green (Pearson's correlation Rr = 0.8237, the value of the Pearson's correlation coefficient is between 1 and −1. The closer to 1, the more perfect correlation; the closer to −1, the more complete negative correlation). e) Confocal fluorescence imaging of HK‐2, AML‐12, H9c2, HepG2, HUVEC, and MCF‐7 cells incubated with 20 µg mL−1 FITC‐LMWC NP at 37 °C for 2 h. f) Confocal fluorescence images of HK‐2 cells co‐stained with CDIA and Lyso Tracker Red (Pearson's correlation Rr = 0.7703). g) Competitive inhibition of cellular uptake of 20 µg mL−1 FITC‐LMWC NP by different inhibitors (1 µm EDTA, 50 µg mL−1 LMWC, or 50 µg mL−1 glucosamine) at 37°C for 2 h. h) Time lapse monitoring of CDIA@FITC‐LMWC NP in CDDP stimulated HK‐2 cells. Cells were successively incubated with CDDP for 24 h and CDIA@FITC‐LMWC NP for 2 h, the images were recorded every 40 s per frame. i) Merged fluorescence and bright field image of CDIA@FITC‐LMWC NP in CDDP stimulated HK‐2 cells. j) Time course of fluorescence intensity collected at circles 1–4 shown in i), corresponding to the areas (1–4). Scale bar: 20 µm.
