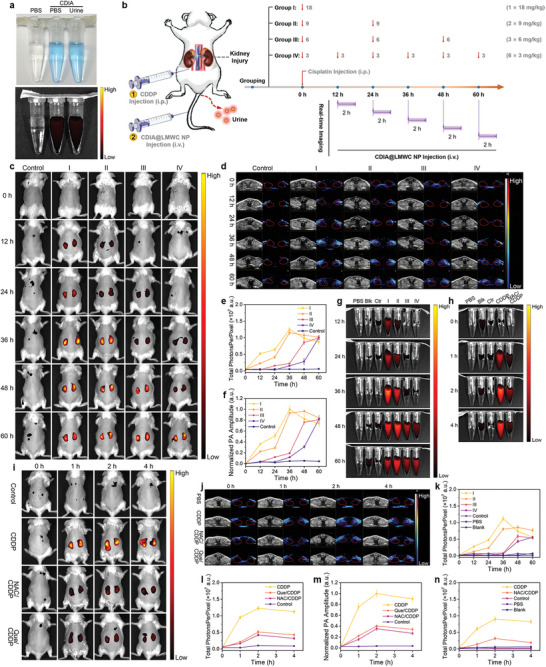
Figure 5.

NIR fluorescence and PA imaging of DIAKI in vivo. a) White light and NIR images of CDIA in PBS and CDIA in the urine excreted from living mice. The corresponding NIR images acquired at 720 nm on excitation at 650 nm with Tanon ABL X6 imaging system. b) Schematic diagram of CDDP treatment in different groups of mice and the timeline of experimental design. Mice were randomly assigned to four experimental groups and a control group. The mice in four groups were treated intraperitoneally with CDDP at the same total dosage of 18 mg k−1 g body weight. Mice in group I were treated once with CDDP at a dosage of 18 mg k−1 g; mice in group II were treated twice with CDDP at each dosage of 9 mg k−1 g; mice in group III were treated thrice with CDDP at each dosage of 6 mg k−1 g; mice in group IV were treated with CDDP at each dosage of 3 mg k−1 g for six times. The mice in control group were treated with PBS. Red arrows indicate for the CDDP injection at different time points. Time‐dependent fluorescence and PA imaging were recorded for 2 h after i.v. injection of 10 mg k−1 g CDIA@LMWC NP, n = 5 for each group. c) In vivo NIR fluorescence images of mice in each group at different time points post‐treatment with CDDP and CDIA@LMWC NP. d) In vivo PA images of mice kidney in each group treatment with different doses of CDDP, followed by i.v injection of CDIA@LMWC NP (10 mg k−1 g body weight) at different time points. e) Fluorescence intensities of mice kidney in (c). f) The normalized PA amplitude of mice kidney in (d). g) Fluorescence images of mice urine under the excitation at 650 nm in each group treatment with different doses of CDDP. h) Fluorescence images of mice urine under the excitation at 650 nm at different post‐treatment timepoints. Representative NIR images (i) and PA images (j) of living mice after injection of CDIA@LMWC NP at different post‐treatment timepoints. The mice were treated with saline, 36 h post‐treatment of 18 mg k−1 g CDDP, or 10 mg k−1 g NAC/Que (i.p. injection) 3 days prior to CDDP administration. k) Fluorescence intensities of mice urine in (g). l) Fluorescence intensities of mice kidney in (i). m) The normalized PA amplitude of mice kidney in (j). n) Fluorescence intensities of mice urine in (h). Data represent mean ± SD, n = 5 independent mice.
