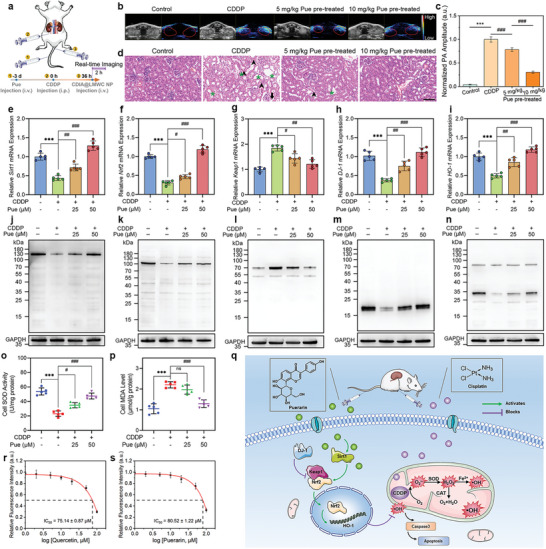
Figure 6.

The counteraction of Pue against CDDP‐induced AKI. a) Schematic diagram of administration of mice. Mice were treated with saline, 18 mg k−1 g CDDP, or Pue (5 mg k−1 g or10 mg k−1 g, i.v. injection) 3 days prior to CDDP administration. b) In vivo PA images of mice kidney with different administrations. c) The normalized PA amplitude of mice kidneys in (b). Data represent mean ± SD, n = 5 independent mice. d) H&E staining images of the kidneys from mice in different administration groups. Scale bar: 100 µm. Relative mRNA expressions of e) Sirt1, f) Nrf2, g) Keap1, h) DJ‐1, and i) HO‐1 in HK‐2 cells after respective treatments with CDDP, and Pue plus CDDP. Western blot analysis of the j) Sirt1, k) Nrf2, l) Keap1, m) DJ‐1, and n) HO‐1 levels in HK‐2 cells after treatments, n = 5 independent experiments. Measurement of o) SOD activities and p) MDA levels in HK‐2 cells following various treatments. q) Schematic illustration of the remaining quantities of Pue reducing the levels of •OH by decomposing CDDP‐induced •OH into H2O and O2, via activating the Sirt1/Nrf2/Keap1 signaling pathway. Chemical •OH scavenging by r) Que and s) Pue with CDIA (10 µm) in PBS buffer at 37 °C, λex/em = 650/720 nm. Data represent mean ± SD (n = 5), * P < 0.05, ** P < 0.01, *** P < 0.001, #P < 0.05, ##P < 0.01, ###P < 0.001; one‐way ANOVA with multiple comparisons test.
