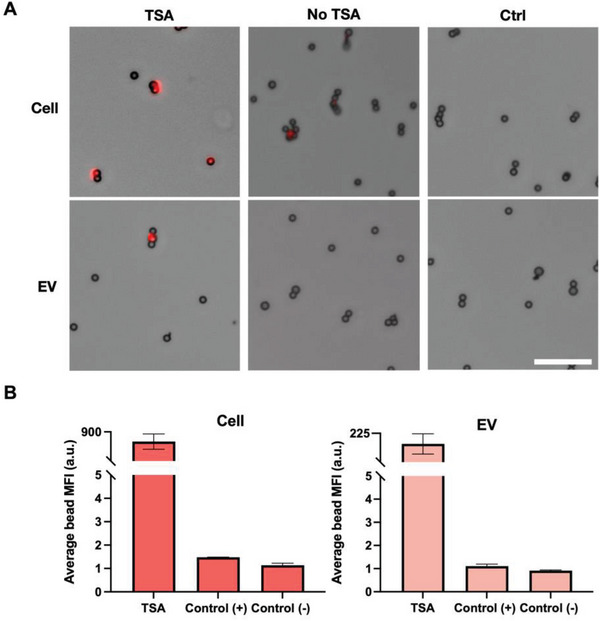
Figure 2.

TSA off‐chip. A) EGFR protein capture and amplification from cell and EV lysis on epoxy beads: TSA, positive control (no TSA), and negative control (ctrl). (Scale bar = 20 µm) B) Quantification of mean fluorescence intensity (MFI = a.u.) from off‐chip TSA. For image analysis, the fluorescence intensity was measured from individual beads and then averaged among the others in the same frame. Three images were quantified for each condition (n=3).
