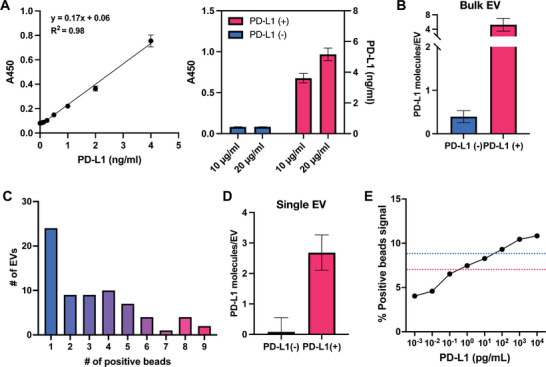
Figure 5.

Digital counting of PD‐L1 molecules per EV. A) Standard curve created using recombinant human PD‐L1 proteins. The standard curve data presented in the figure were collected from triplicated individual samples (n=3). Bulk PD‐L1 (+/−) EVs loaded at different concentrations (10 and 20 µg mL−1) and detected with ELISA. B) Average number of PD‐L1 molecules coming from single PD‐L1(+/−) EVs based on ELISA. C) The number of positive beads per single PD‐L1(+) EV (n=70). D) The average number of PD‐L1 molecules per single PD‐L1(+/−) EV. E) The percent positive beads for synthetic PD‐L1 protein capture and detection. Three images were quantified for each condition (n=3). LOD reported for TSA (red) and ELISA (blue).
