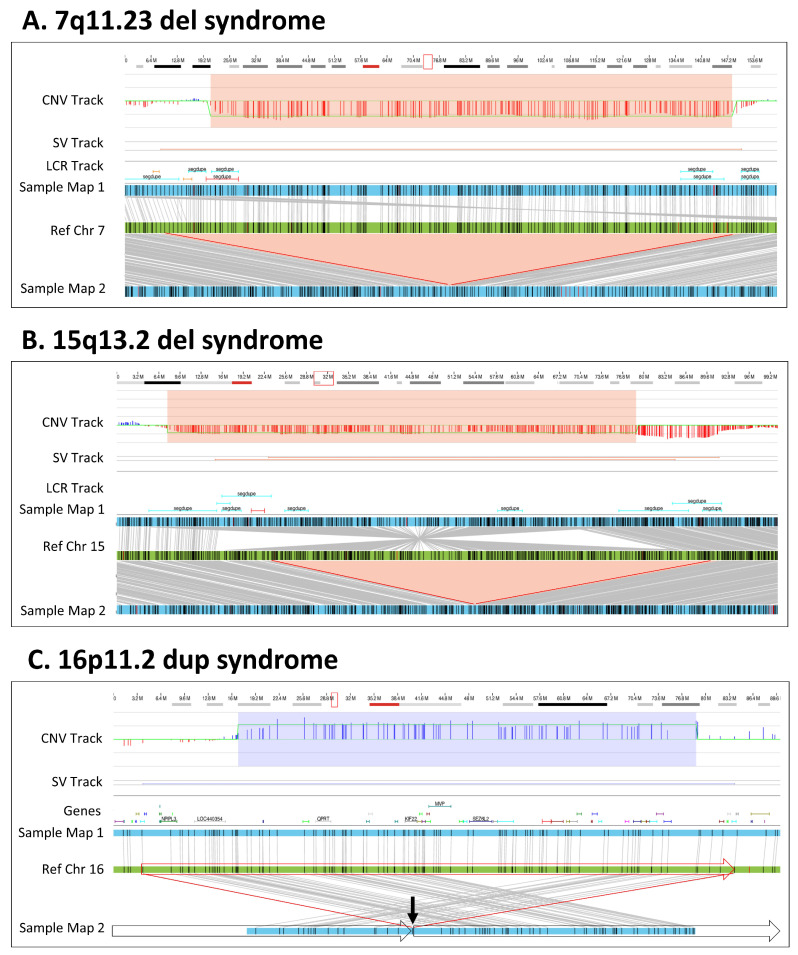
Figure 2.
Microdeletion/duplication syndromes. (A) A 1.9 Mbp heterozygous copy number loss in the 7q11.23 region. The red box in the cytoband on the top of the figure indicates the region of interest that is shown below. The deletion is captured by two OGM variant-calling algorithms—the copy number and the de novo assembly algorithms. In the top track, the copy number profile shows a one-copy drop. The bottom track shows that two assembled maps in blue align to the reference in green. The upper assembled Map 1 represents the reference allele, whereas the lower Map 2 captures the 1.9 Mbp deletion. Together the maps indicate that the deletion is heterozygous (Sample 8). (B) A 1.9 Mbp heterozygous copy number loss in the 15q13 region. The top track shows that the deletion is called by the copy number algorithm. The assembly pipeline shows that two distinct haplotype resolved alleles; one precisely shows the 1.9 Mbp deletion (Map 2) and the other (Map 1) carries an inversion with an additional 0.5 Mbp loss compared with the reference (Sample 15). (C) A 0.7 Mbp tandem duplication in 16p11.2. The copy number profile indicates a copy number of three. The de novo assembly delineates the structure and orientation of the duplication; the three copies occur on two haplotypes, with one copy on Map 1 and two copies in tandem order on Map 2. Due to the size of the duplication, the OGM molecules do not cover the entirety of the duplication. Instead, the map alignments show the head-to-tail fusion point indicated by the arrow and subsequent alignments on either side of the duplication. The genomic structure is shown with the boxed arrows around the sample Map 2 (Sample 38).

