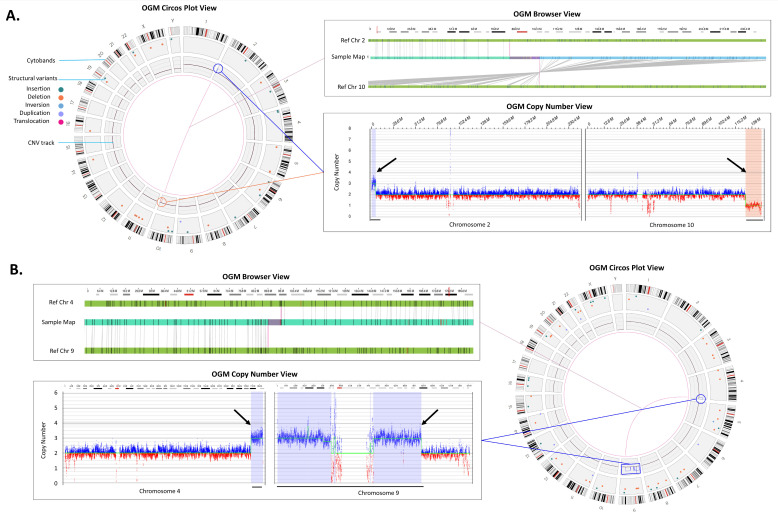
Figure 3.
Translocations. (A) An unbalanced translocation detected between chromosomes 2 and 10. Left panel: Circos plot summary displaying SVs unique compared to the Bionano control database, sample (Sample 36). The translocation and the accompanying gain in 2p (blue line and circle) and loss in 10q (red line and circle) are shown via a line connection. Top right panel: The red box in the cytoband on the top indicates the region of interest that is shown below. The genome browser view details the alignment of the sample’s consensus map (light blue bar) with the reference consensus maps (light green bars) and provides the detail of the structural variation. Bottom right panel: The Y-axis represents the copy number level and X-axis gives the chromosome position, the CNV plot showing gain on chromosome 2 and loss on chromosome 10 (black arrows). (B) Rearrangements indicating the presence of a derivative chromosome (Sample 41). Top left panel shows a zoomed in view of a t(4;9) translocation. Bottom left panel shows copy number gains whose breakpoints coincide with the translocation breakpoints (black arrows). Combining both events (blue line and circle) in the circos plot on the right panel, we can infer that the gains and fusions between chromosomes 4 and 9 represent +der(9)t(4;9).

