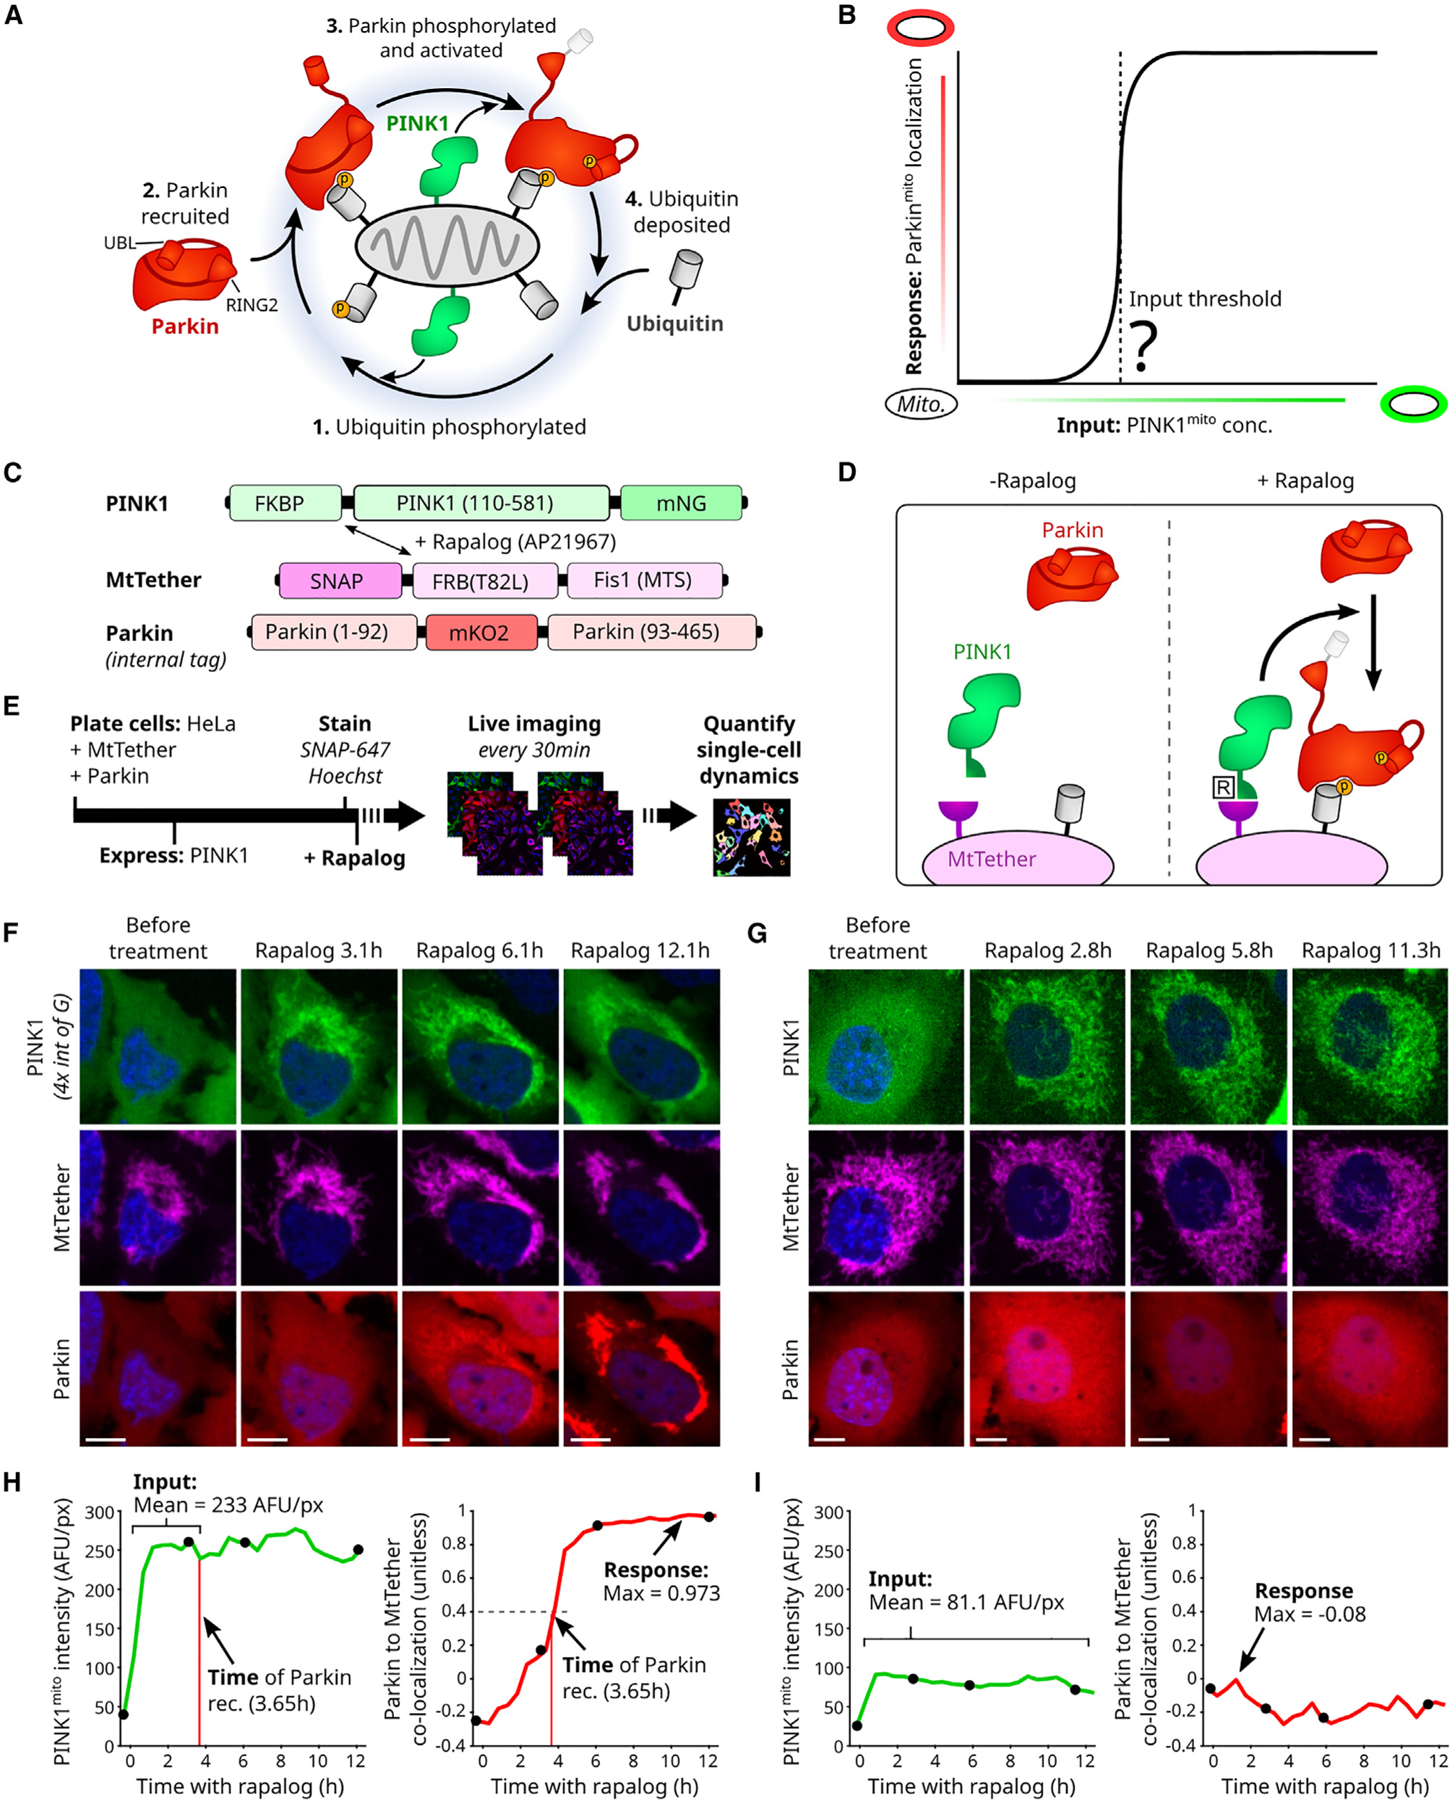
Figure 1. Quantification of input-to-output responses for a minimal PINK1/Parkin synthetic circuit.

(A) Cartoon of PINK1/Parkin positive feedback loop. Yellow circles: phosphorylation sites. Conformational changes of activated Parkin’s UBL (ubiquitin-like) and catalytic RING2 domains are shown.
(B) Hypothetical input-response relationship (curve) illustrating a PINK1 input threshold for circuit activation (vertical dashed line). Inputs: discrete mitochondrial PINK1 concentrations, held stable over time.
(C and D) PINK1/Parkin synthetic circuit using rapalog-induced recruitment. Mitochondrial targeting sequence (MTS) of PINK1, amino acid 1–109, removed. T82L: mutation required for rapalog binding.
(E) Live-cell imaging approach. Rapalog treatment: 200 nM. SNAP-647: fluorescent SNAP ligand for far-red imaging of MtTether (STAR Methods). Bar length not to scale.
(F and G) Representative time-lapse images of cells with (F) or without (G) Parkinmito recruitment in response to induced recruitment. Scale bars: 10 μm. Relative intensity visualization range noted in (F).
(H and I) Quantification of circuit input (mean concentration), circuit response (max Parkinmito recruitment), and the time of Parkinmito recruitment for cells in (F) and (G). AFU: arbitrary fluorescence units. Co-localization: intensity correlation (Pearson, STAR Methods). Black points: time points in (F) and (G). See also Figures S1 and S2.
