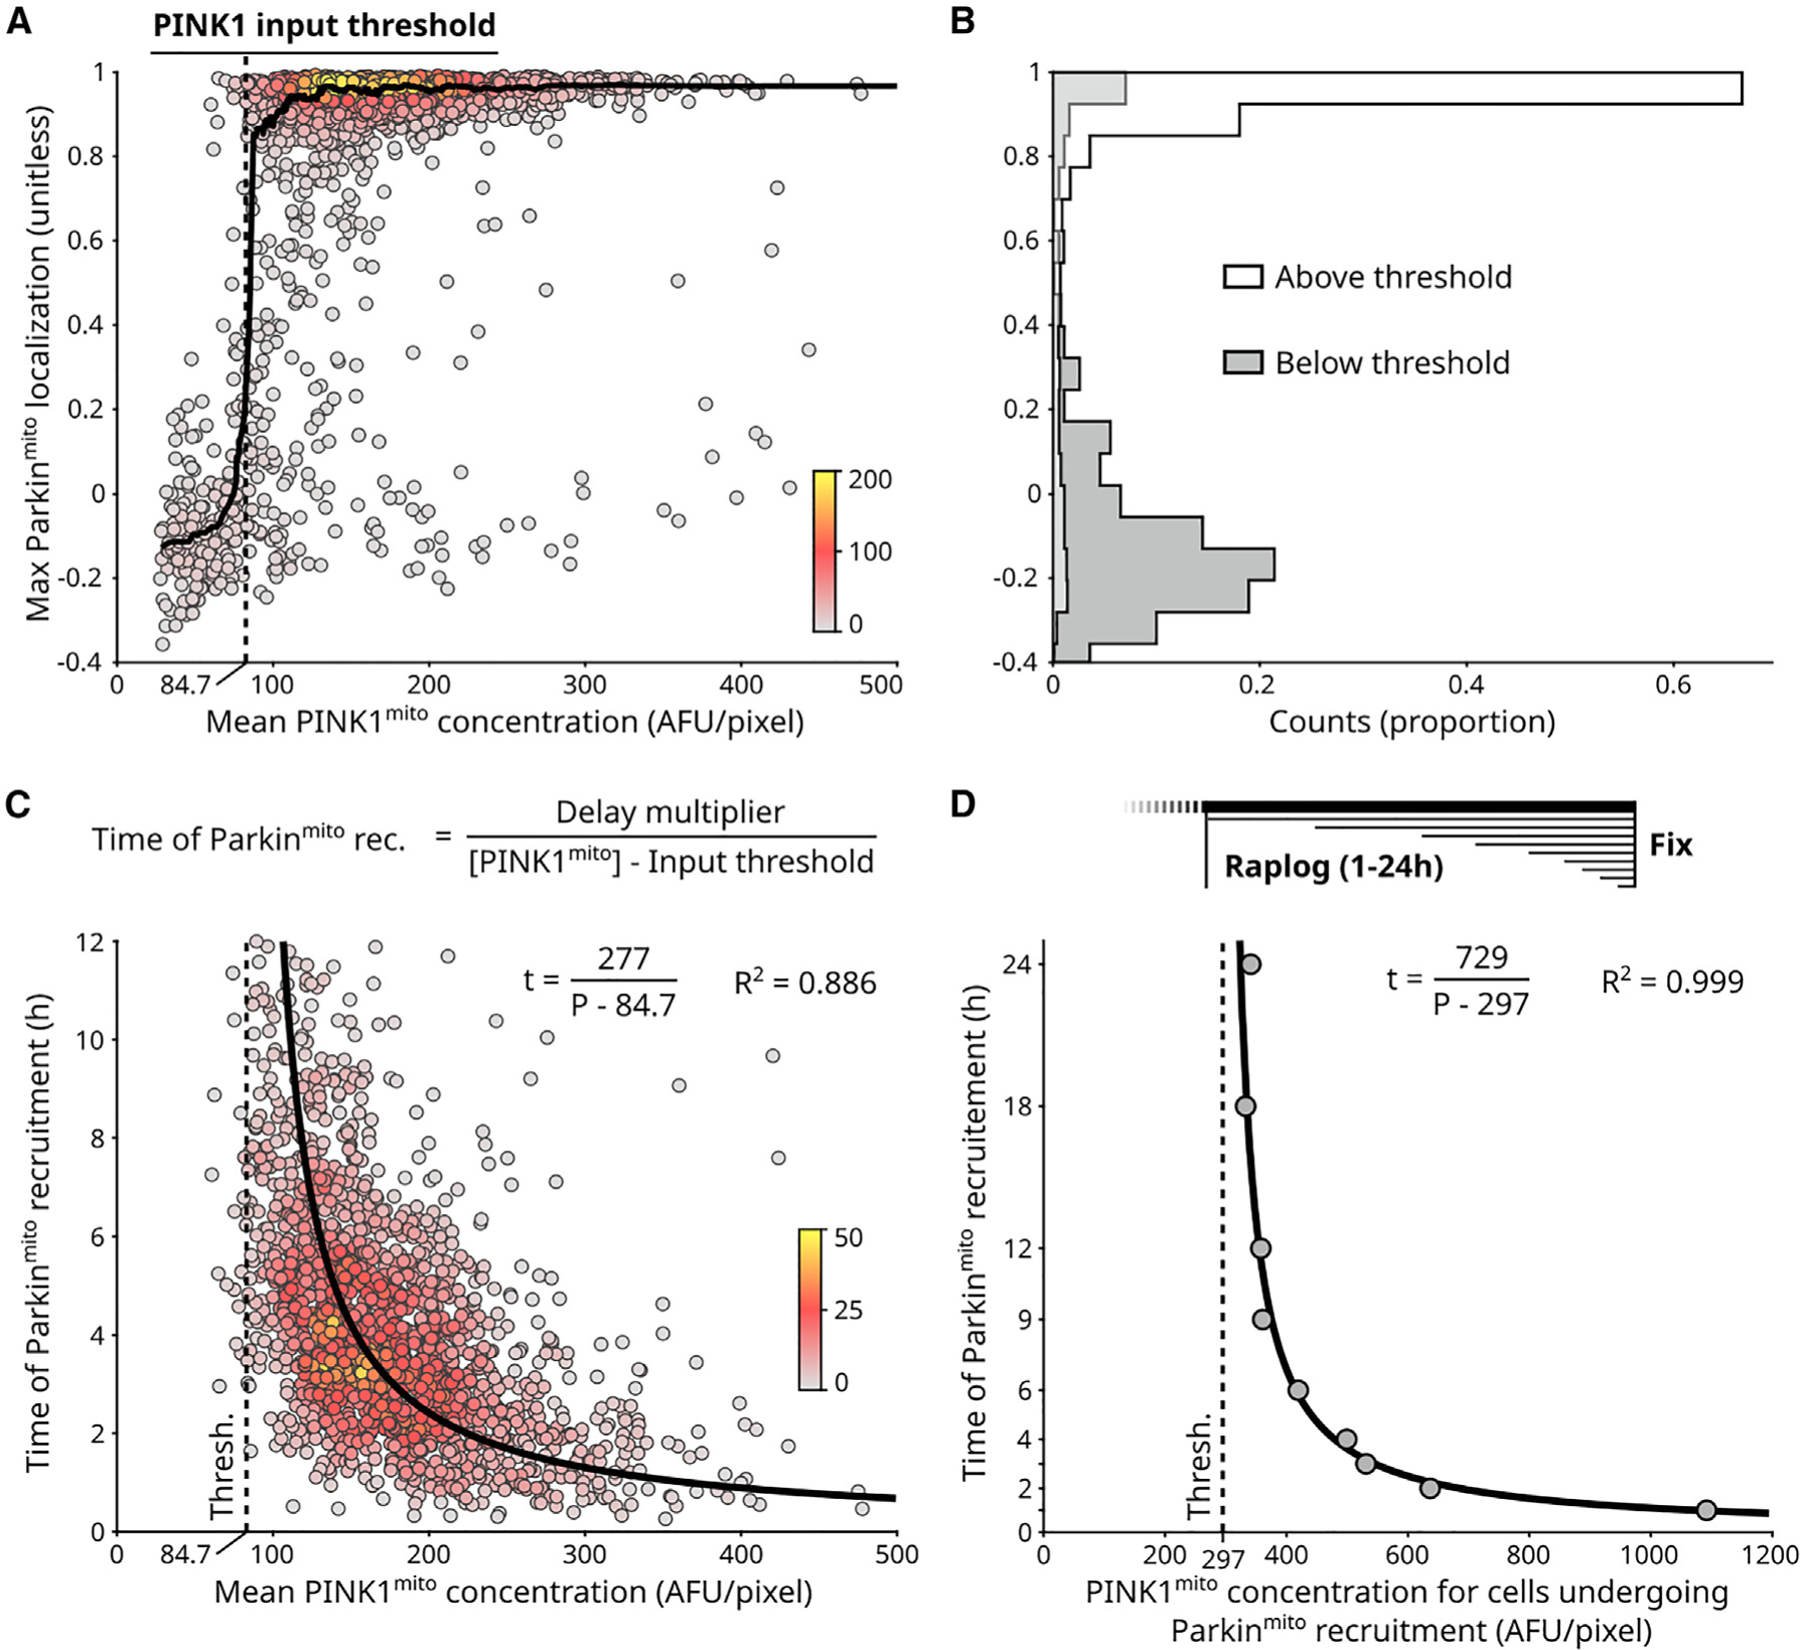
Figure 2. A PINK1 concentration threshold controls activation of the PINK1/Parkin circuit.

(A) Single-cell measurements for circuit input ( concentration) and circuit response (Parkinmito localization) for n = 1,987 cells (Figures 1H and 1I; STAR Methods). Points: individual cells, colored by local point density (number of nearby points, STAR Methods). Solid line: sliding median. PINK1 input threshold: concentration required for Parkinmito recruitment (STAR Methods).(B) PINK1 input threshold separates cells with and without Parkinmito recruitment.
(C) Timing of Parkinmito recruitment has a reciprocal relationship to . Points: n = 1,676 cells with Parkinmito recruitment from (A) (Figure 1H; STAR Methods), colored by local point density. General equation of reciprocal relationship is shown. Delay multiplier numerator defines hyperbolic relationship. Fitted hyperbolic curve and R2 value are shown. Brackets: concentration.
(D) PINK1 input threshold (dashed line) and timing hyperbola (solid line) quantified using analysis of fixed cells following various durations of rapalog treatment (Figures S2K and S2L; STAR Methods). Points: aggregate quantification from n > 14,000 fixed cells per rapalog treatment duration. See also Figures S2 and S3.
