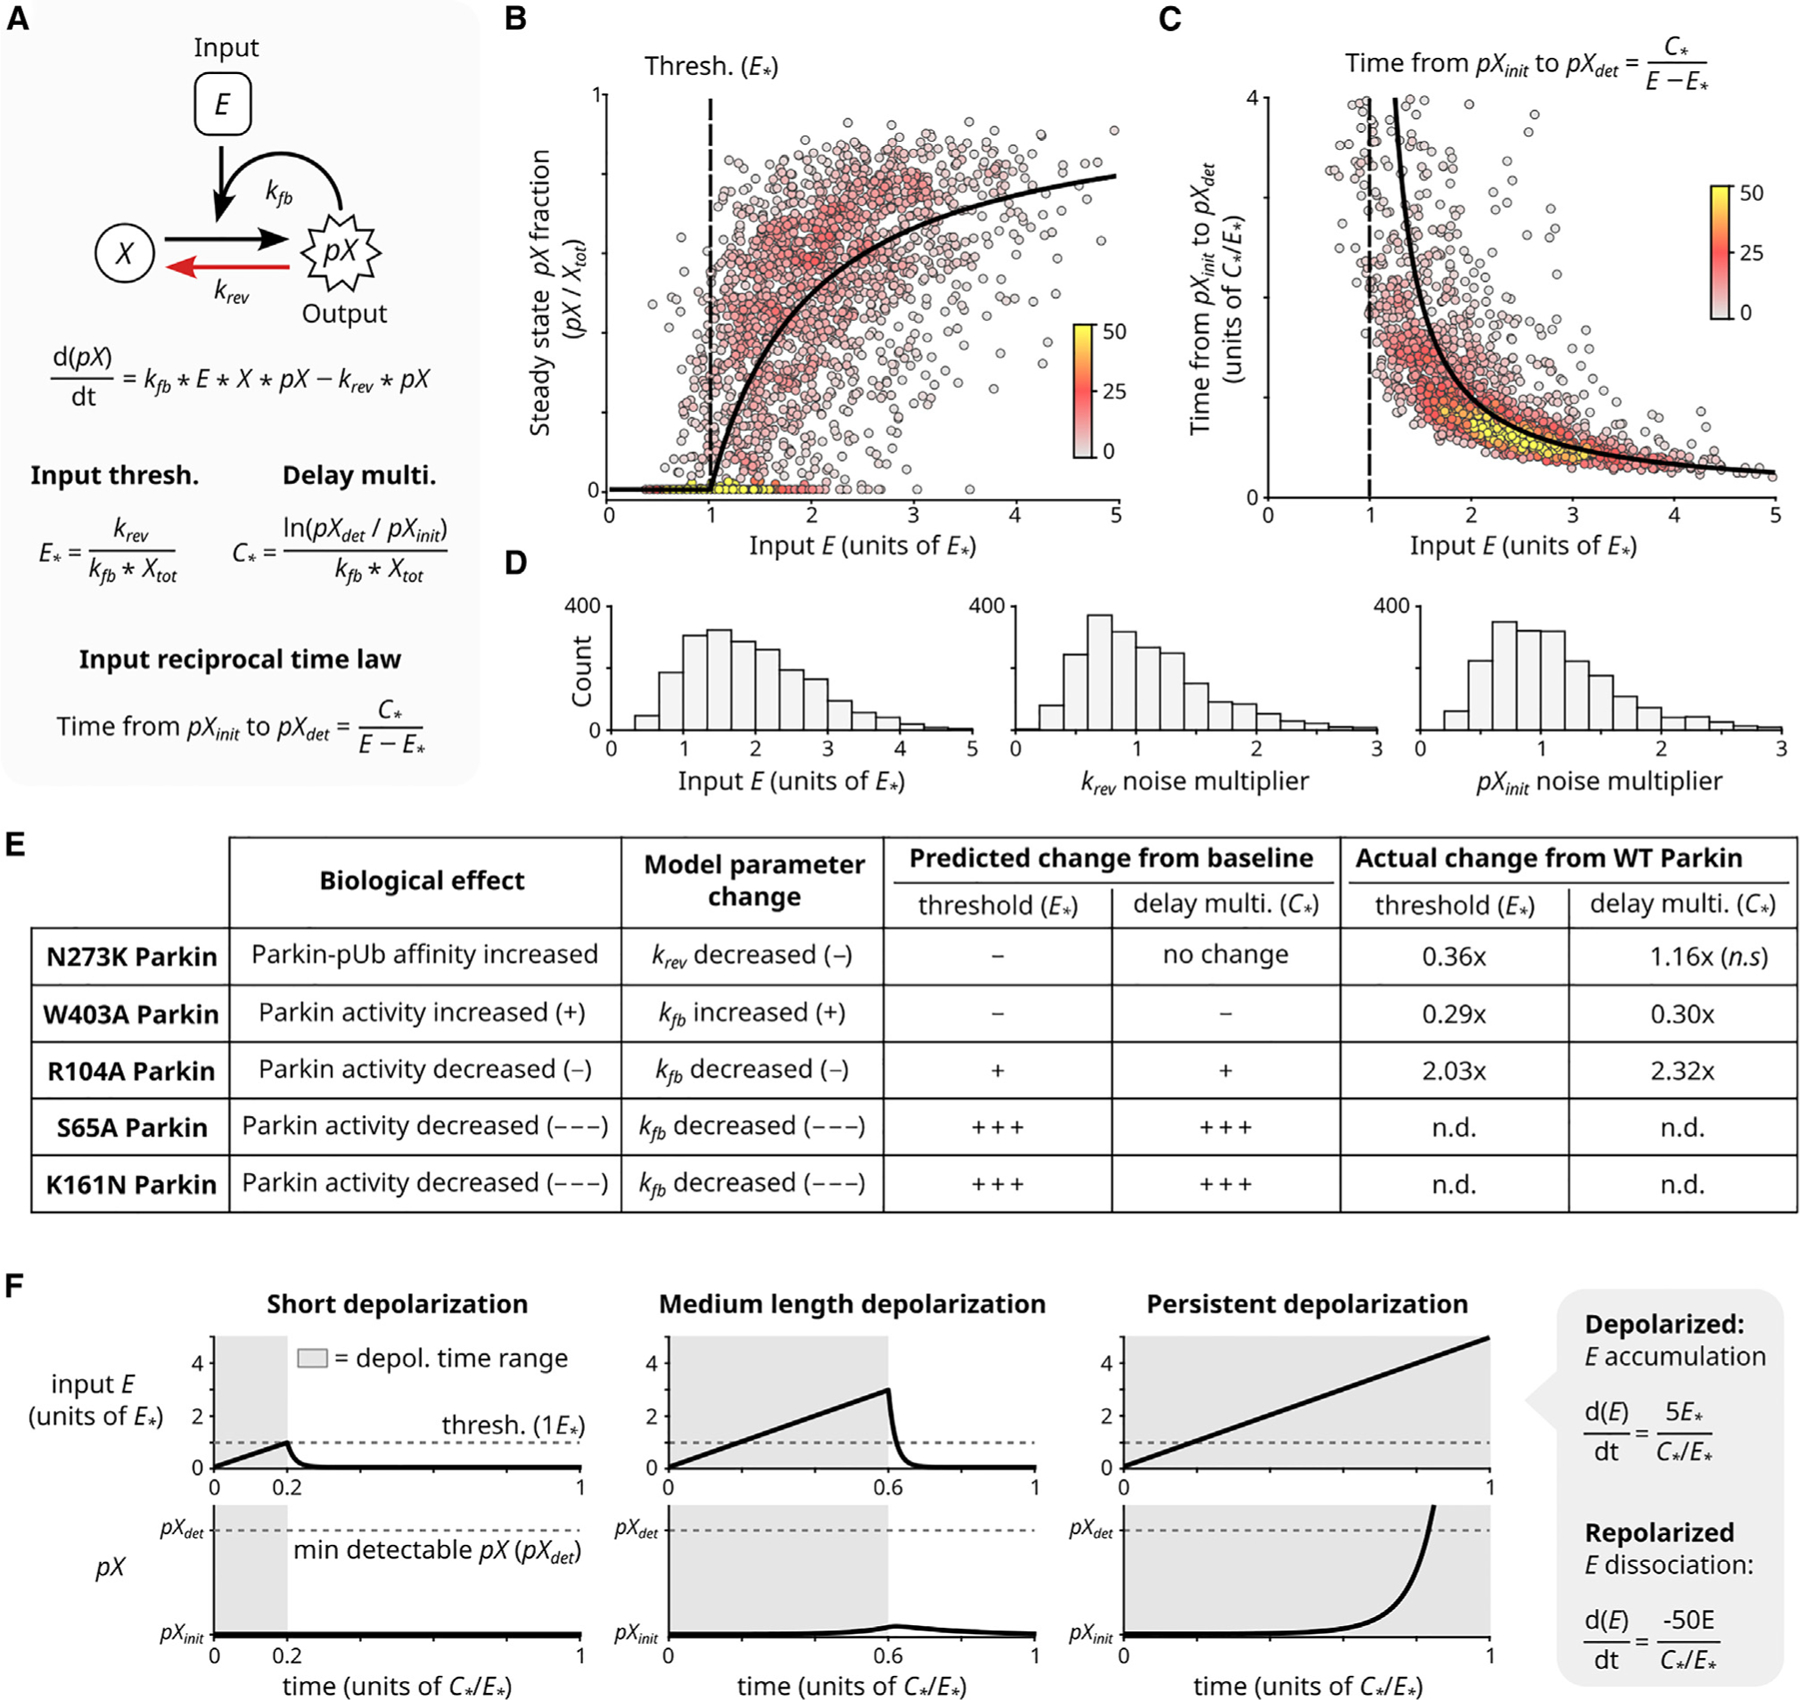
Figure 5. Input threshold and reciprocal activation delay properties arise within a minimal model of input-coupled positive feedback.

(A) Minimal model of input-coupled positive feedback. : total concentration of (note ). : initial concentration of (note ). : detection concentration of (note ). Parameters and govern input threshold and reciprocal activation delay, respectively. Derivations and model generalization are described in Method S1.
(B–D) System steady-state analysis (B) and relationship between input and time to reach detectable output levels (C). Black curves: algebraic solutions of (A). Points: simulated cell heterogeneity; 2000 cells were simulated, each with a randomly selected value of and randomly selected multiplier for , and . Distributions of randomly selected values are shown in (D) (STAR Methods). Colors: local point density. For analogous experimental data, see Figure S2I and Figure 2C.
(E) The minimal model algebraically predicts experimentally observed effects of Parkin mutations on circuit’s input threshold and reciprocal activation delay behavior (from Figure 4C).
(F) The minimal model can filter out simulated transient depolarization events. Simulated depolarization (and accumulation) for varying lengths of time, followed by repolarization (and dissociation). Rates of accumulation and dissociation are noted (STAR Methods). Short depolarization yields no (i.e., ). Medium depolarization yields negligible (i.e., ). Only sustained depolarization yields detectable (i.e., ). See also Figure S5.
