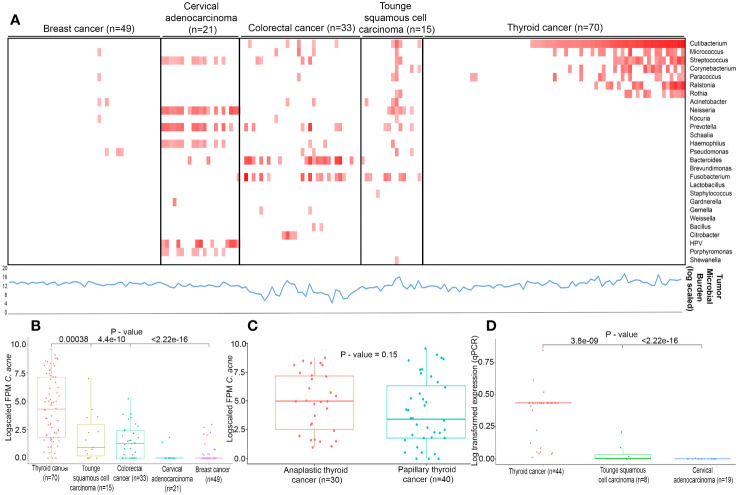
Figure 1.
Landscape of infectious pathogens (A) Heatmap describes infectious pathogen burden in different cancer types identified from RNA-seq using IPD tool. Red colour square box indicates the log fold FPM in ascending order (0 to 12) as generated by IPD tool. Lower line (blue in colour) graph denotes Tumor Microbial burden (log scaled) quantified by Kraken2 (B) Expression levels (log fold FPM) of Cutibacterium acnes in different cancer types of Indian cohorts. (C) Expression levels (log fold FPM) of Cutibacterium acnes in Anaplastic and Papillary thyroid cancers in Indian cohort. (D) Expression levels (log transformed) of Cutibacterium acnes validated by qPCR in different cancer types of Indian cohorts.

