Fig. 1.
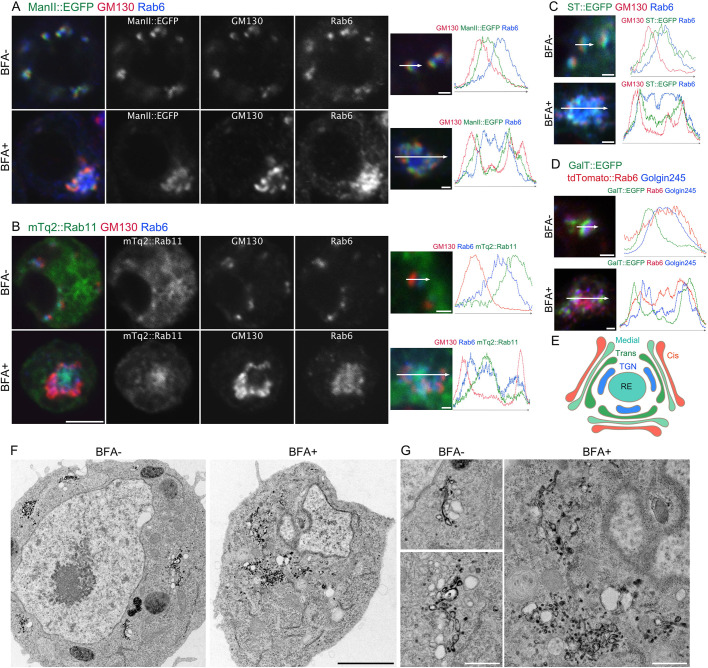
BFA induces the formation of BFA bodies. (A,B) Left, representative immunostaining of S2 cells expressing ManII::EGFP (A) or mTq2::Rab11 (B) (green) incubated without (upper panels) or with 50 μM BFA (lower panels) with anti-GM130 (red) and anti-Rab6 (blue) antibodies. Right panels, plots of signal intensities from image to the left. Signal intensities were measured along the 1.5 µm (upper) or 5 µm (lower) arrows shown in inset. Graphs show the overlap between channels. (C,D) Left pictures are immunostaining of S2 cells expressing ST::EGFP (green) (C) or GalT::EGFP (green) and tdTomato::Rab6 (red) (D) incubated without (upper panels) or with 50 μM BFA (lower panels) by anti-GM130 (red) and anti-Rab6 (blue) antibodies (C) or by anti-Golgin245 antibody (blue) (D). Right plots of signal intensities from image on the left. Signal intensity was measured along the 1.5 µm (upper) or 5 µm (lower) arrow in inset, graph shows the overlap between channels. (E) Schematic of the structure of a BFA body. (F,G) Electron micrographs of S2 cells expressing GalT::APEX2::EGFP without or with 50 μM BFA. GalT::APEX2::EGFP was visualized by osmium-enhanced DAB-depositions. Scale bars: 5 μm (A,B, left panels), 1 μm (A,B, right panels, C,D), 2 μm (F), and 500 nm (G).

