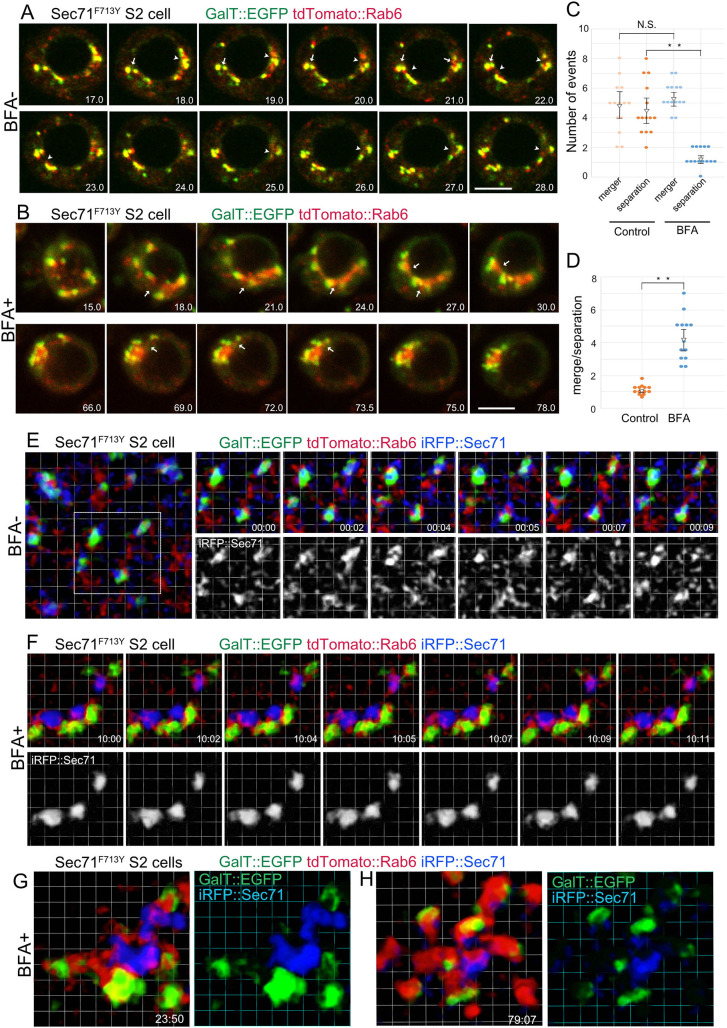
Fig. 4.
Live imaging of BFA body formation. (A,B) Frames from time-lapse movies of BFA-hypersensitive S2 cells carrying the Sec71F713Y substitution, and also expressing GalT::EGFP (green) and tdTomato::Rab6 (red) with (B) or without 25 μM BFA treatment (A) observed by confocal microscopy. Numbers at right bottom corners indicate the time (min) after BFA addition (B) or start point of time-lapse observation (A). Arrows or arrowheads indicate mergers or separations of TGN of two or more Golgi stacks. (C) Quantifications of mergers or separations of TGNs in untreated (left) and BFA-treated S2 cells (right). (D) Ratios of mergers to separations of TGNs in untreated (left) and BFA-treated (right) S2 cells carrying the Sec71F713Y substitution. Error bars show mean±s.d. (E–H) Frames of time-lapse movies of S2 cells carrying the BFA-hypersensitive Sec71F713Y substitution, also expressing GalT::EGFP (green), tdTomato::Rab6 (red) and iRFP::Sec71 (blue) with (F–H) or without 25 μM BFA treatment (E) observed by SCLIM. Numbers at the right bottom corners indicate the time (min:sec) after BFA addition (F–H) or start point of time-lapse observation (E). Scale bars: 5 μm (A,B); Grid: 1 μm (E–H). **P<0.01, N.S., not significant (unpaired two-tailed Student's t-test).

